
In 2010, the US Department of Health and Human Services’ Administration for Children and Families awarded a first round of five-year HPOG grants (HPOG 1.0) to 32 organizations in 23 states, including five Tribal organizations. In 2015, the administration’s Office of Family Assistance awarded a second round of five-year HPOG grants (HPOG 2.0) to 32 organizations across 21 states, including five Tribal organizations. The Administration for Children and Families extended the second round by one year. The Office of Family Assistance also funded a portfolio of evaluation studies across both rounds of grants.
Unless otherwise noted, the following figures are for HPOG 2.0.
Who participants were:
- HPOG 1.0 served more than 36,000 people, and HPOG 2.0 served more than 38,000 people, totaling 74,000 people across 11 program years.
- The majority of HPOG participants were women in their twenties and thirties, many of whom (68 percent) had one or more dependent children.
- Most participants identified as non-Hispanic Black or African American (43 percent) or non-Hispanic white or Caucasian (24 percent). Twenty-two percent of participants identified as Hispanic or Latino, and 6 percent identified as non-Hispanic American Indian or Native Alaskan.
- Most participants (71 percent) had household incomes of less than $20,000, and 19 percent also received TANF at intake.
What they did:
- More than 80 percent of HPOG participants started at least one health care training. Of those, the completion rate was 78 percent.
- The largest share of participants took a single, entry-level training.
- Participants trained for many occupations, but the most common by far was CNA training, started by 30 percent of all participants, followed by home health aid training (10 percent).
- Program funds typically covered most or all of the cost of training. Grantees also directly offered or provided referrals for various academic, personal, logistical, and employment supports.
- Before starting training, participants who needed to improve their skills could take basic skills or prerequisite subject matter courses.
Participant Outcomes
The following infographic summarizes key participant outcome statistics from HPOG 2.0.
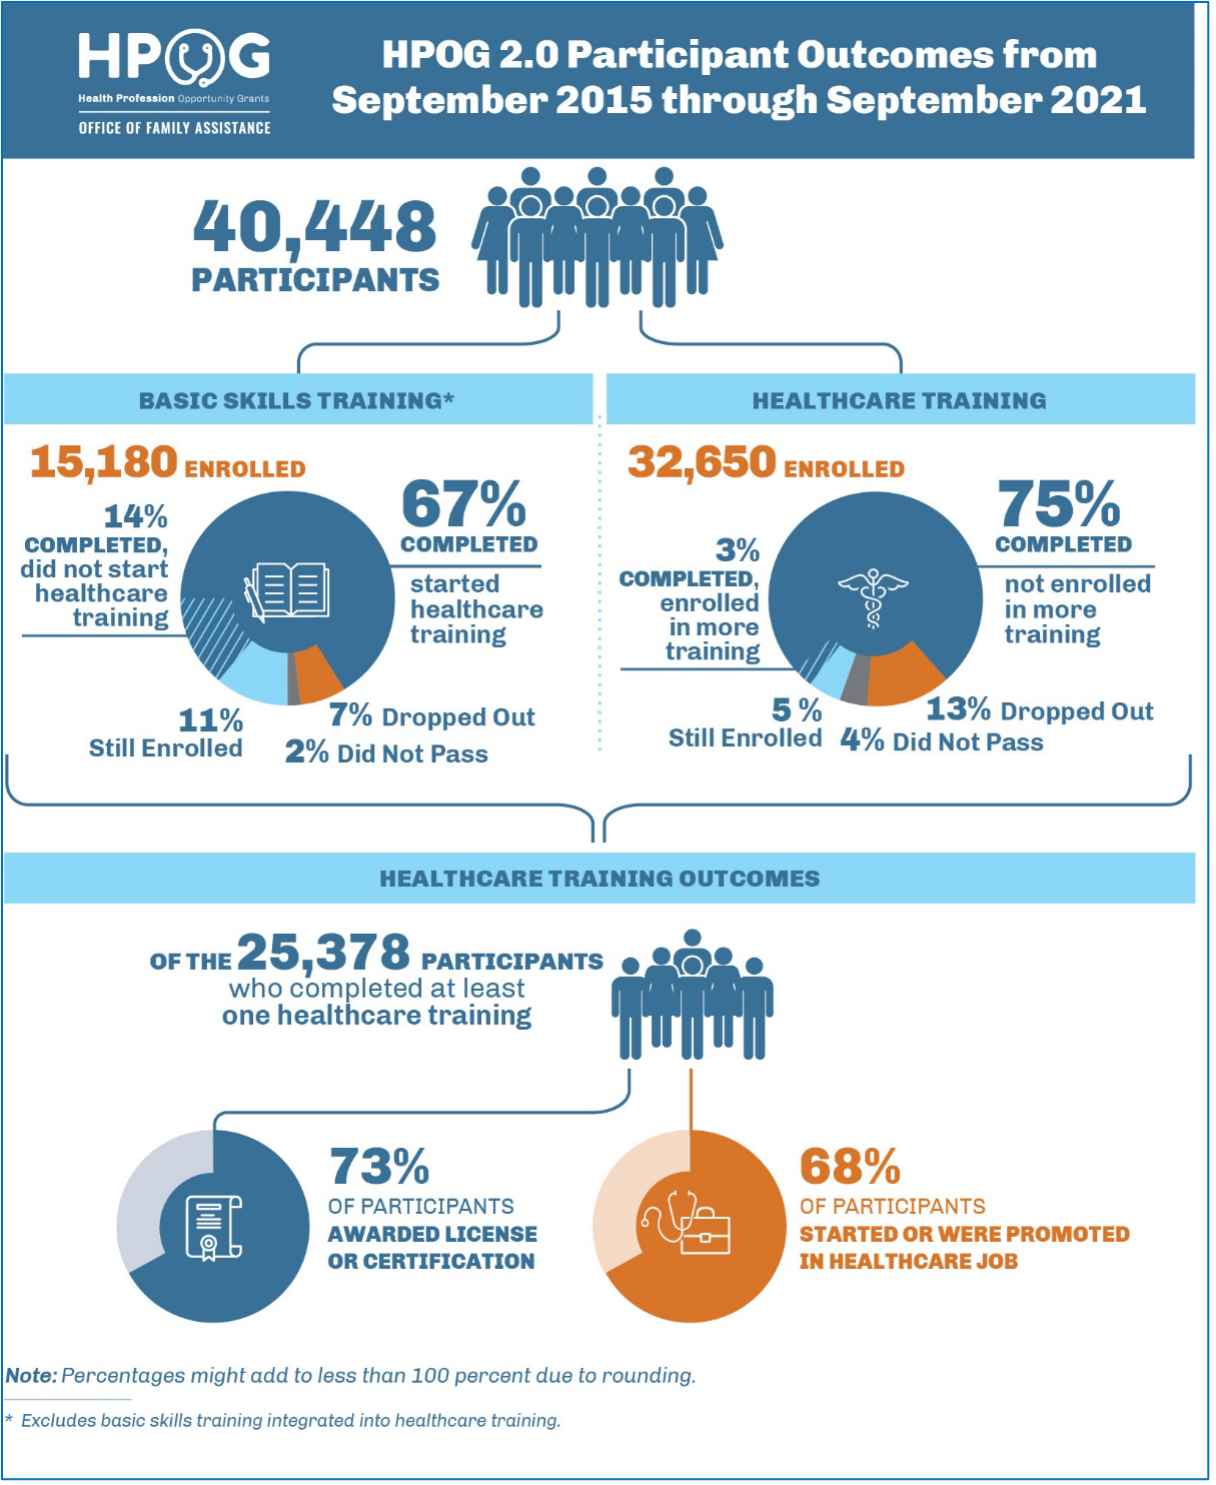
Through both rounds of HPOG, Urban and its partners have analyzed and reported on the activities participants have engaged in (such as trainings and supports) and their education and employment outcomes. We also reported on the types of activities grantees offered and annual trends throughout both rounds of HPOG. The following publications summarize those trends:
- Health Profession Opportunity Grants (HPOG 2.0) National Evaluation: Outcomes Study Report. August 2023. This report includes the descriptive outcomes of HPOG 2.0, including measures of career progress in training, employment, and earnings.
- National and Tribal Evaluation of the 2nd Generation of Health Profession Opportunity Grants (HPOG 2.0): Descriptive Evaluation Analysis Plan for the National Evaluation. September 2020. This report presents an analysis plan for the descriptive evaluation of HPOG 2.0.
- Improving Economic Opportunity through Health Care Training: Findings from the Health Profession Opportunity Grants Program. January 2019. This fact sheet briefly describes HPOG evaluation findings to date.
- Descriptive Evaluation Design Report for the National Evaluation. March 2018. This report presents the research design plan for the descriptive evaluation of HPOG 2.0.
- Final Report: National Implementation Evaluation of the First Round Health Profession Opportunity Grants (HPOG 1.0). December 2017. This report summarizes HPOG training and services during HPOG 1.0. It also describes the education, employment, and earnings outcomes for samples of participants at different periods after enrollment.
- Descriptive Implementation and Outcome Study Report: National Implementation Evaluation of the Health Profession Opportunity Grants (HPOG) to Serve TANF Recipients and Other Low-Income Individuals. June 2016. This report includes findings from the HPOG 1.0 descriptive implementation and outcome studies. It addresses how grantees implemented their programs and describes participant outputs and outcomes.
- Health Profession Opportunity Grants: Summary of Interim Outcomes. August 2015. This brief summarizes key findings from the Interim Outcome Study Report: National Implementation Evaluation of the Health Profession Opportunity Grants (HPOG) to Serve TANF Recipients and Other Low-Income Individuals report, released in 2014.
- Interim Outcome Study Report: National Implementation Evaluation of the Health Profession Opportunity Grants (HPOG) to Serve TANF Recipients and Other Low-Income Individuals. September 2014. This report on HPOG 1.0 participants shares interim outcomes in health care training completion, employment, pretraining activities, and receipt of support services.
- Design Report: National Implementation Evaluation of the Health Profession Opportunity Grants (HPOG) to Serve TANF Recipients and Other Low-Income Individuals. February 2014. This report presents the evaluation design for the HPOG 1.0 national implementation evaluation.
The HPOG annual reports chronicle program activities and descriptive outcomes for each year of both rounds. The final annual reports provide a summary of each program round.
HPOG 2.0
- Key Findings from the Final Annual Report of the Health Profession Opportunity Grants (HPOG) Program, 2015–2021. November 2022. This brief highlights key findings from Health Profession Opportunity Grants 2.0: Final Annual Report.
- Health Profession Opportunity Grants 2.0: Final Annual Report. November 2022.
- Health Profession Opportunity Grants 2.0: Year Five Annual Report (2019–20). October 2021.
- Health Profession Opportunity Grants 2.0: Year Four Annual Report (2018–19). June 2020.
- Health Profession Opportunity Grants 2.0: Year Three Annual Report (2017–18). June 2019.
- Health Profession Opportunity Grants 2.0: Year Two Annual Report (2016–17). July 2018.
- Health Profession Opportunity Grants 2.0: Year One Annual Report (2015–16). July 2017.
HPOG 1.0
- Health Profession Opportunity Grants: Year Four Annual Report 2013–2014. July 2015.
- Health Profession Opportunity Grants: Year Three Annual Report 2012–2013. July 2014.
- Health Profession Opportunity Grants: Year Two Annual Report (2011–2012). January 2014.
- Introduction to the Health Profession Opportunity Grants (HPOG) Program and First Year Implementation and Outcomes. February 2013.
