
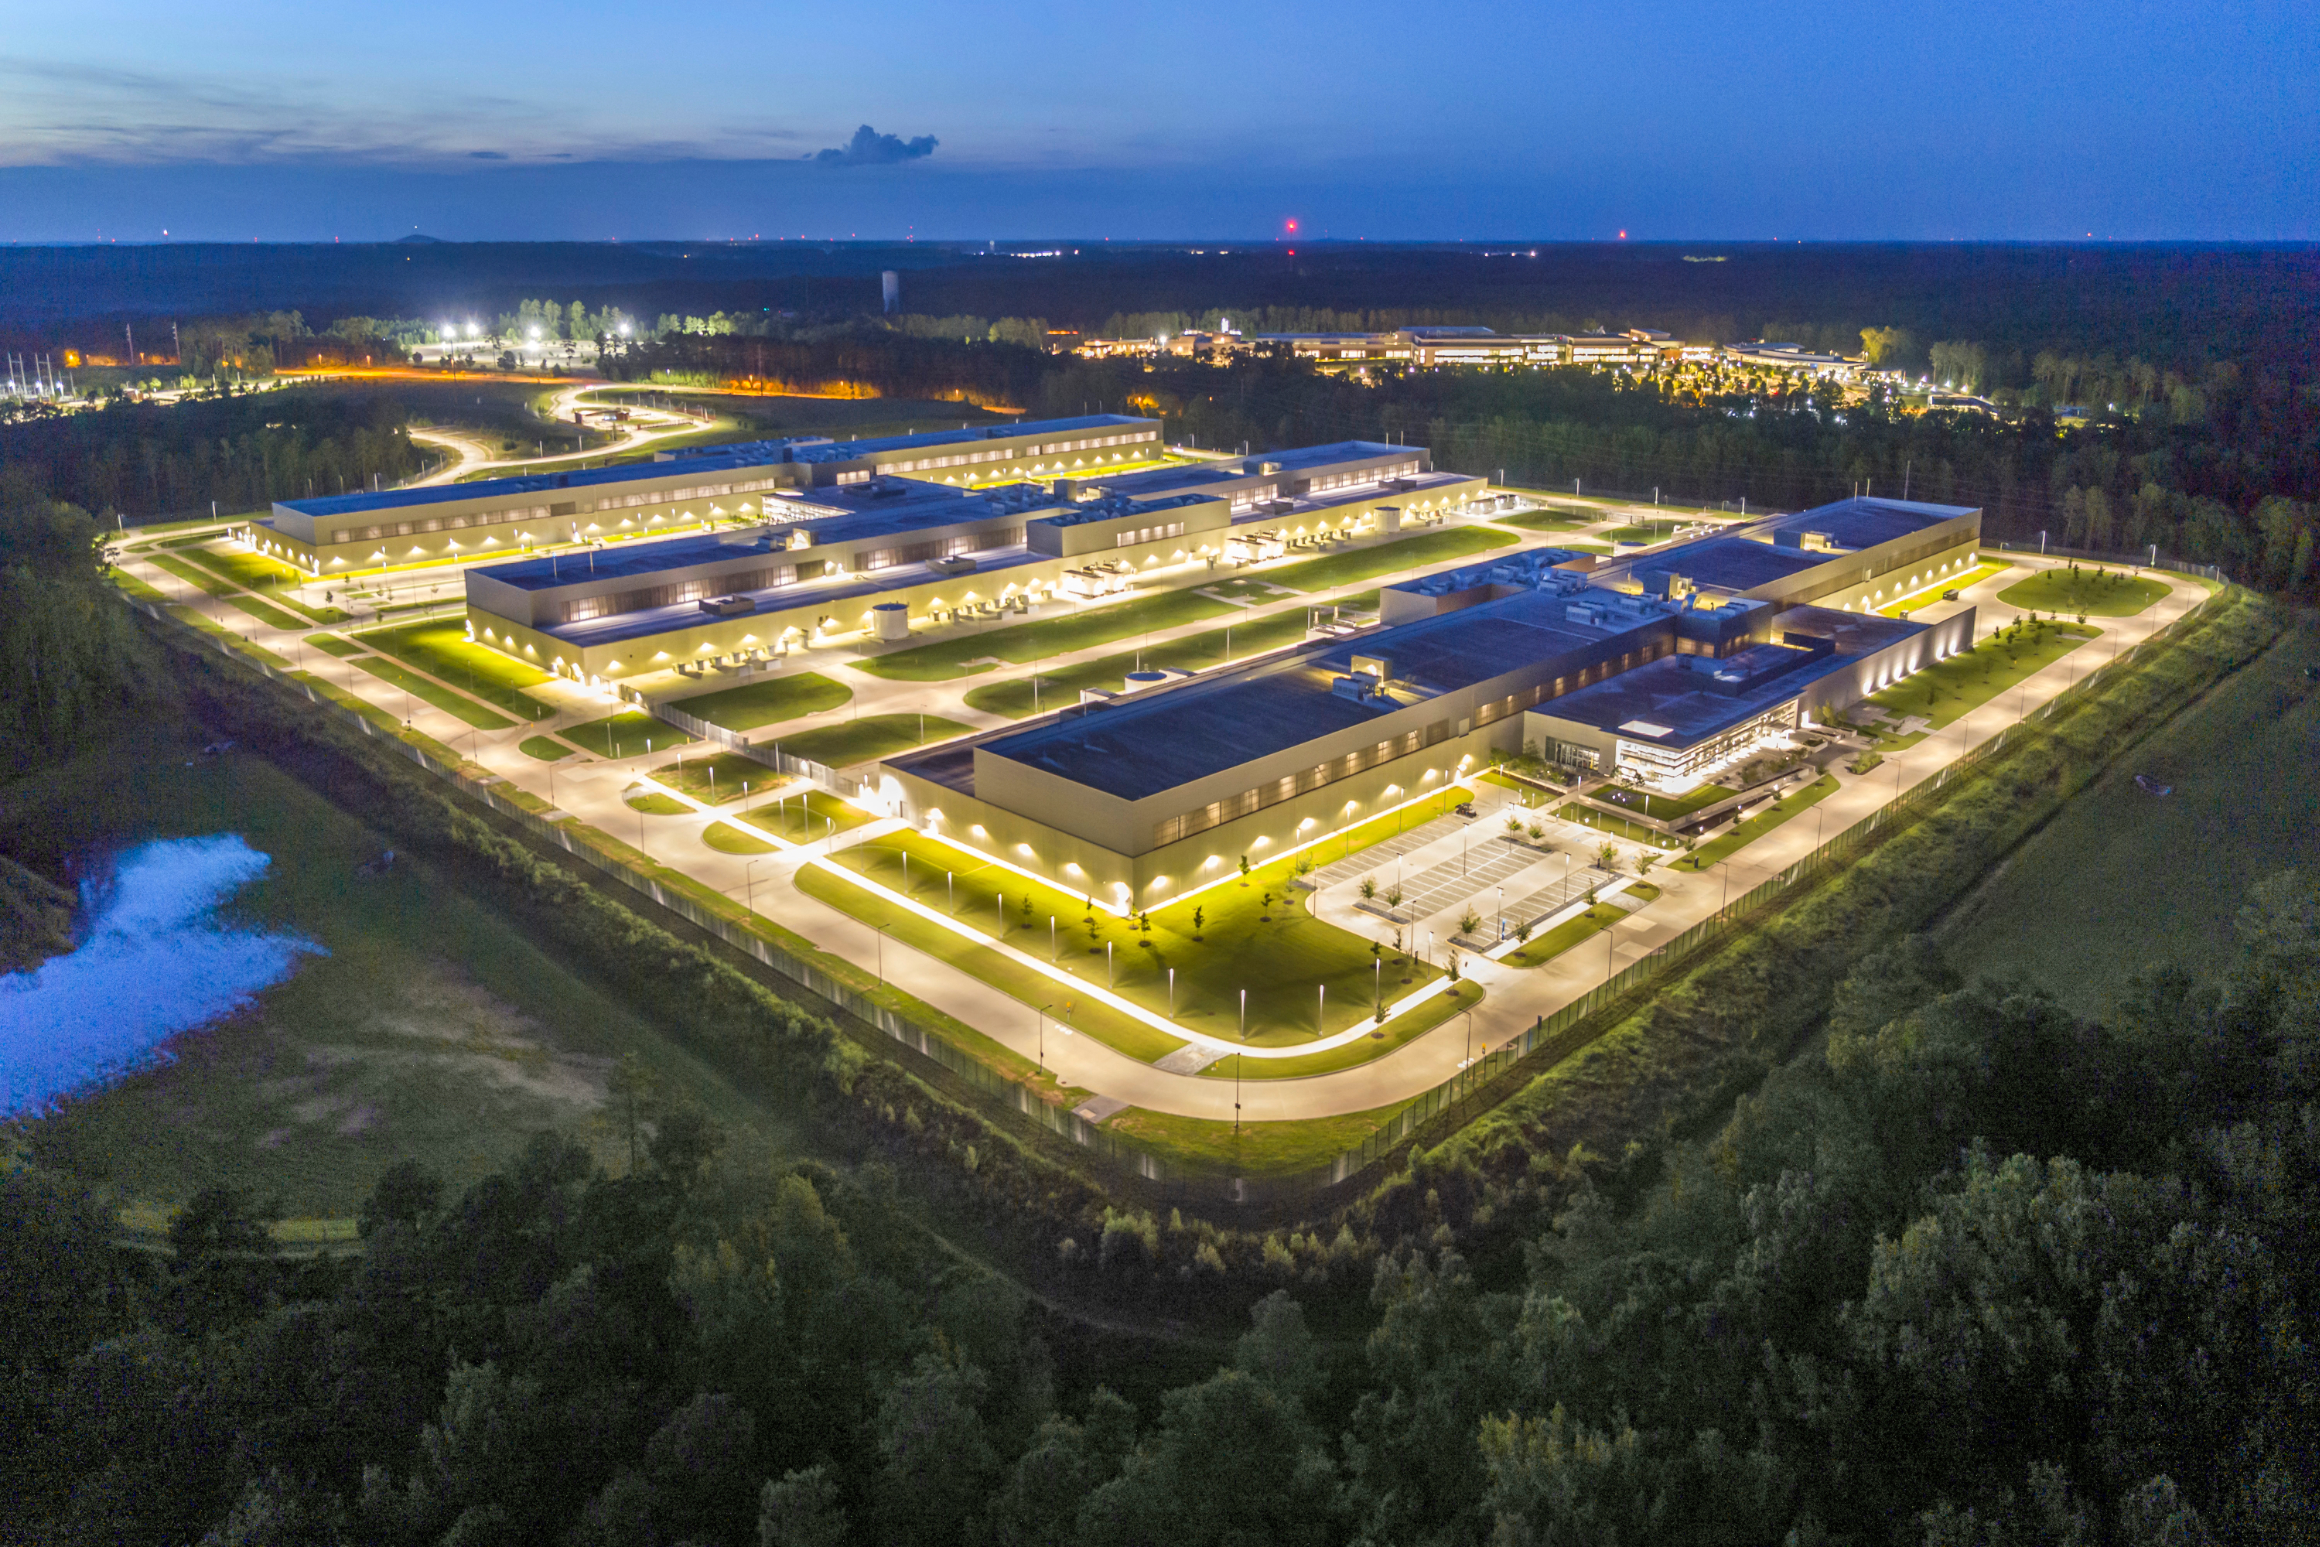
As proposals for new data centers have proliferated across the country, some communities have instituted moratoriums to buy time to weigh potential benefits and costs. Meanwhile, leaders in communities with data centers already in development are facing public pressure to address concerns about energy costs, water usage, and noise pollution.
But the rapid pace of new data center development and the lack of information on their potential effects have made it challenging for communities to determine how different populations may be affected.
The Urban Institute’s Spatial Equity Data Tool (SEDT) offers state and local policymakers, as well as community advocates, a simple way to visualize where data centers are being built and who they could affect at the national, state, county, and city levels.
Here, we outline how leaders can use the SEDT to answer the following questions:
- Are data centers evenly distributed across my state?
- Which communities are over- or underrepresented in counties with data centers?
- Within my county, which communities are over- or underrepresented in neighborhoods with data centers?
We use Georgia as an example because it’s one of the fastest-growing markets for data centers in the country.
Are data centers evenly distributed across Georgia?
Analyzing data centers geographically can provide leaders with key insights into their potential effects on a community. For example, current data centers are clustered in urban areas, while new data centers are more likely to be proposed in more rural areas. But recent research suggests rural areas don’t experience the same employment and new business growth as urban areas, like Loudoun County, Virginia, which has received millions in tax revenue from incentivizing new data center development.
In Georgia, rapid data center growth has spurred local resistance. Fulton County commissioners approved a resolution opposing tax abatements and other financial incentives for new data center projects in August. Milton and Chatham Counties have adopted moratoriums, while policymakers in Douglas County denied a zoning permit for a new hyperscale data center in July after the county’s 90-day moratorium expired.
To understand how and which communities in Georgia could be affected by new or proposed data centers, we used the SEDT to assess whether they’re evenly spread around the state. First, we downloaded data from the FracTracker Alliance, which provides a tally of permitted, existing, and proposed data centers in the US, as a CSV file. Then, we took the following steps:
- Navigated to the SEDT home page and selected “state” as the geography.
- Uploaded the CSV with the FracTracker Alliance data.
- Under “advanced options,” applied and saved filters to examine Georgia’s sites where data centers are proposed, operating, approved, permitted, or under construction.
- Ran the tool.
After mapping all the data center sites, the SEDT computed and presented two metrics:
- A geographic score, which is the difference between the share of Georgia’s data centers and the share of Georgia’s overall population located in each county.
- A demographic score, which shows whether members of a given demographic group are over- or underrepresented in areas near data centers, relative to their distribution throughout the state.
We found that Fulton County (shaded in dark blue on the map below) has 25.6 percent more potential or existing data center sites than we would expect if they were distributed across the state proportionally by population. Fulton County is the site of 35.5 percent of all potential and existing data centers in Georgia but represents only 9.9 percent of the state’s population.
Residents of Fulton County Disproportionately Reside Near Potential and Existing Data Centers
Screenshot of SEDT showing showing counties in Goergia shaded by geographic disparity score
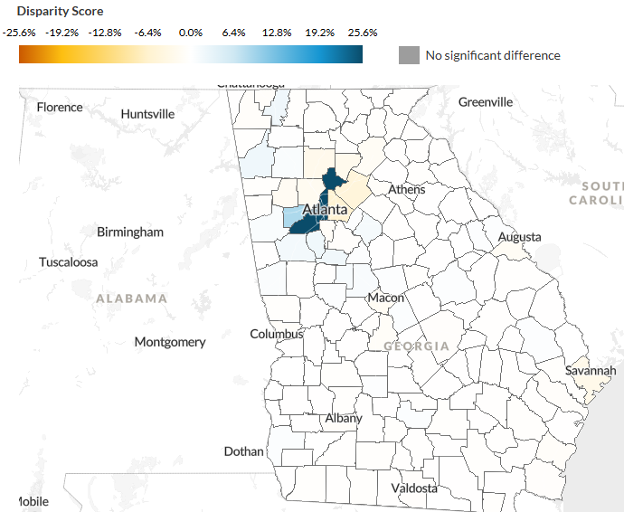
Source: Spatial Equity Data tool (SEDT) analysis of known data centers flagged as operational, under construction, permitted, proposed, or approved by the FracTracker Alliance. Extracted September 15, 2026.
Notes: Geographic disparity scores represent the difference between the share of Georgia’s data centers and the share of Georgia’s population located in a particular county. Data centers can range in size in the source data. We do not delineate size characteristics here because the size of many data centers in the data is not specified. The FracTracker Alliance collects data through “scans of media announcements, incorporation of partner datasets, public records, permit documents, parcel data, and Freedom of Information Act/Right to Know request responses.” This process preferences proposals and undercounts existing data centers compared to industry standard sources such as DataCenterMap, although we confirmed that using this dataset would not meaningfully shift results for Georgia.
Though this map highlights where data center development activity is disproportionate, more context is needed to understand its effects on residents. For example, a hyperscale data center could affect a rural county’s residential electrical bills relatively more than an urban county’s, depending on how governing regulatory frameworks incentivize utilities to divide costs.
Which communities are over- or underrepresented in Georgia counties with data centers?
The SEDT also provides a chart highlighting demographic characteristics of neighborhoods with data centers.
Statewide, we find that Black residents are overrepresented in their proximity to potential and existing data centers by 11.8 percent. Within Fulton County, Black residents are overrepresented by 14.8 percent in their proximity to data centers.
Black Residents Disproportionately Reside in Areas of Georgia with Proposed or Completed Data Centers
Screenshot of SEDT showing the demographic distribution of data centers in Georgia
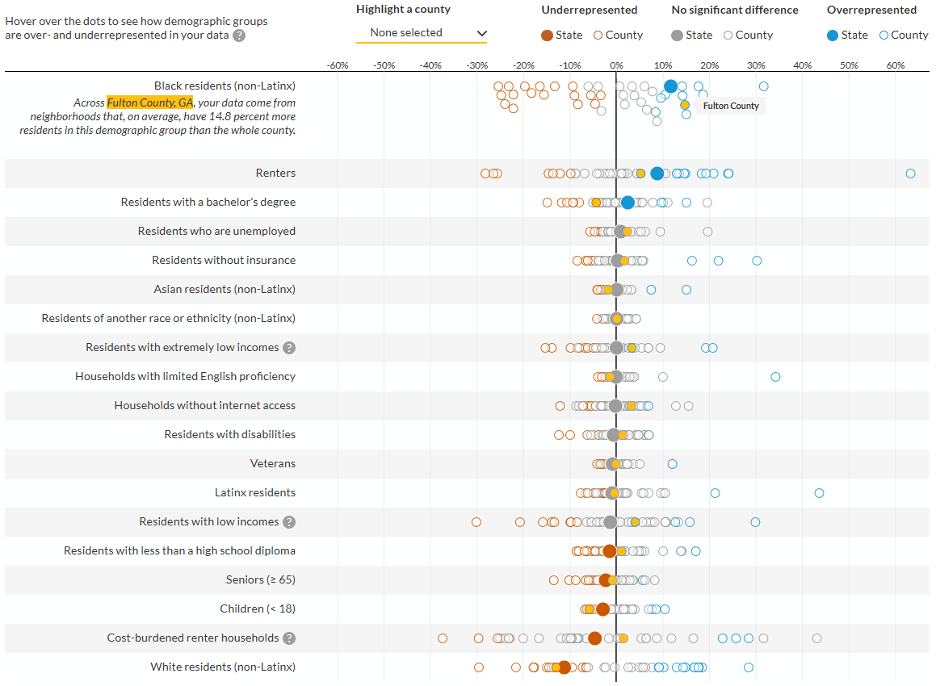
Source: Spatial Equity Data tool (SEDT) analysis of known data centers flagged as operational, under construction, permitted, proposed, or approved by the FracTracker Alliance. Extracted September 15, 2026.
Notes: Demographic disparity score represents the difference between the share of the population in the tracts where data centers are located and the state as a whole for a given demographic group. Statistical significance is computed using several US Census Bureau–provided formulas.
As proposed data center projects are completed, Fulton County will host a disproportionate amount of data centers in the state. Within the county, these sites will be unevenly concentrated in places where Black residents are more likely to reside. Given that historically Black residents have been disproportionately exposed to polluting or harmful infrastructure, this raises the question of whether history is repeating itself with the spatial patterning of data center developments.
Within Fulton County, which communities are over- or underrepresented in neighborhoods with data centers?
Next, we used the SEDT to examine the distribution of data centers across neighborhoods in Fulton County and neighborhoods’ demographic characteristics. To do this, we
- Reloaded the SEDT home page.
- Reuploaded the data and selected the SEDT’s county-specific option.
- Applied and saved filters to examine Fulton County’s sites where data centers are proposed, operating, approved, permitted, or under construction.
- Ran the tool.
Again, the tool generates a dot plot showing Black residents are 14.8 percent overrepresented in their proximity to data centers compared with Fulton County’s overall population, whereas white residents are 12.9 percent underrepresented.
Scrolling down to the county map, we see the area of downtown Atlanta that intersects with the historically Black, Sweet Auburn neighborhood contains 20 percent of potential and existing data centers, while representing 0.2 percent of the county population. Sweet Auburn was one of many Black neighborhoods that were partly demolished following the Federal-Aid Highway Act of 1956, a notable example of racialized environmental and transportation injustice in Atlanta.
Downtown Atlanta Is the Site of 20 Percent of Potential and Existing Data Centers in Fulton County, But Is Home to 0.2 Percent of the County’s Population
Screenshot of SEDT showing the distribution of data centers in Fulton County, by neighborhood
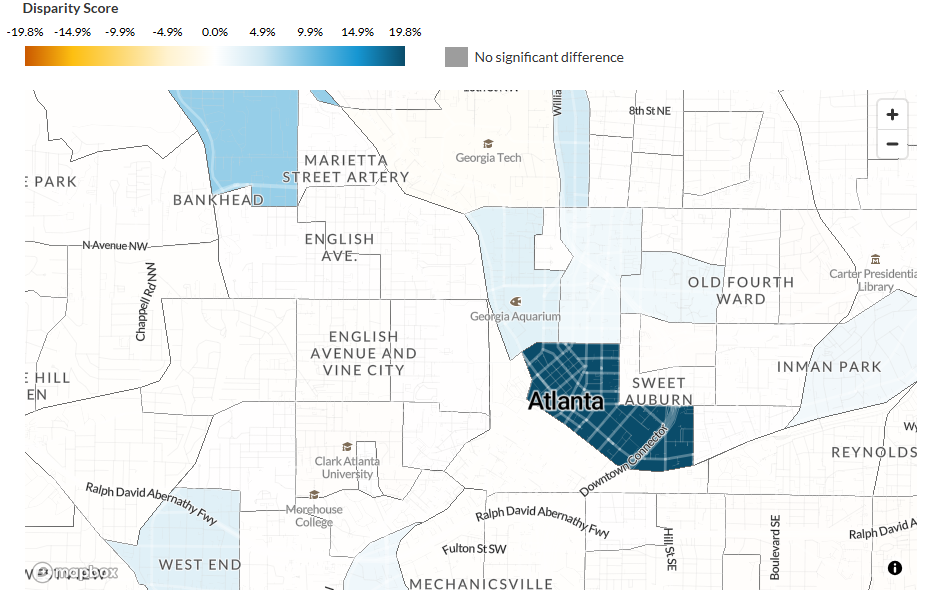
Source: Spatial Equity Data tool (SEDT) analysis of known data centers flagged as operational, under construction, permitted, proposed, or approved by the FracTracker Alliance. Extracted September 15, 2026.
Notes: Fulton County is not fully displayed here, to assist with readability.
Additionally, much of Fulton County’s existing data center infrastructure is downtown, which, among other factors, can make the area more attractive for new development. Though data center siting strategies respond to varying incentives, urban data gravity may promote dense clusters of development.
How can communities navigate data center development?
Though the SEDT can show which populations could be affected, it doesn’t capture all the potential costs and benefits.
Local policymakers and advocates could consider several questions when exploring a site for a data center:
- Which communities have already absorbed major industrial development, and how has that affected them?
- What are the potential health impacts of a data center?
- Does your city or county have data on major industrial development, and can this be compared with proposed data center activity?
- Who benefits from these developments, and what incentives are driving them?
To understand data centers’ broader effects, it’s also important to look beyond their physical locations. Data centers impose higher energy demands on electrical grids, which can raise costs across neighborhoods and produce pollution that can travel beyond boundary lines. By exploring local, regional, and statewide spatial analyses, policymakers and advocates can approach data center development from a deliberative, informed stance.
Additionally, data centers vary greatly in size. Here, we choose to focus on all data centers, given limitations in FracTracker’s data for Georgia. But local leaders and advocates in other states might consider mapping proposed hyperscale data centers because of their significant potential environmental and energy impacts.
As data center proposals continue to proliferate, these and other questions can help local policymakers weigh the potential economic gains against the possible costs to their communities and more deeply engage their communities in the decisionmaking process.
