On January 31, the Corporation for Enterprise Development released its annual Assets and Opportunity Scorecard. For the first time, the report included estimates of “liquid asset poverty”—the share of American households with insufficient liquid assets (e.g., bank accounts, stocks, mutual funds, and retirement accounts) to subsist at the poverty level for three months. In 2009 an estimated 43 percent of U.S. households did not have enough liquid assets to protect themselves from a major income loss or emergency expense. This represented a slight uptick from the pre-recession level of 41 percent in 2006. Among states, liquid asset poverty rates in 2009 varied by a factor of more than two, with Hawaii, New Hampshire, and Vermont below 25 percent, while Alabama, Georgia, Mississippi, and West Virginia each topped 55 percent.
At a time when the government’s official measure of income poverty has undergone serious review, we should also apply the same critical eye to asset poverty statistics. In light of the prolonged unemployment spells recently experienced in the American labor force, the three-month measure seems too limited. In 2009 more than half (51 percent) of the nation’s jobless were without work for 15 weeks or more. This figure jumped to 59 percent in 2010, and these estimates do not count discouraged workers no longer looking for jobs.
In which states was the combination of pre-recession liquid asset poverty and subsequent prolonged joblessness particularly acute? The map below shows [with horizontal gridlines] the 21 states whose 2006 liquid asset poverty rate exceeded the 41 percent national average.
States With High Rates of Both Liquid Asset Poverty and Prolonged Unemployment Are Concentrated in the South
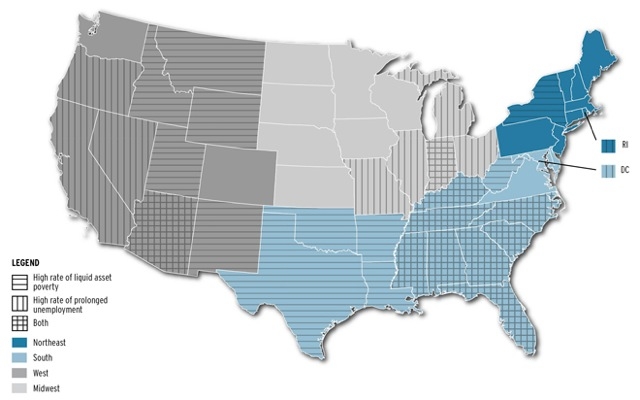
Source: Corporation for Enterprise Development and U.S. Bureau of Labor Statistics
The map also identifies [with vertical gridlines] the 19 states that experienced disproportionately high rates of longer-term joblessness, as evidenced by a 2009 median unemployment duration of 13 or more weeks (i.e., three months or longer) coupled with an unemployment rate at or above that year’s 9.3 percent national average. Of the 10 states (in cross-hatch) where both liquid asset poverty and prolonged joblessness were prevalent, 8 were in the South. Workers in the South have clearly faced a dual challenge, with a risk of hardship greater than that confronted in other regions.
The focus on liquid asset poverty is long overdue. As more and more data become available on this important dimension of household economic security, we should be attentive to issues of measurement and geographic concentration.
Let’s help communities build more secure, hopeful futures.
Today’s complex challenges demand smarter solutions. Urban brings decades of expertise to understanding the forces shaping people’s lives and the systems that support them. With rigorous analysis and hands-on guidance, we help leaders across the country design, test, and scale solutions that build pathways for greater opportunity.
Your support makes this possible.