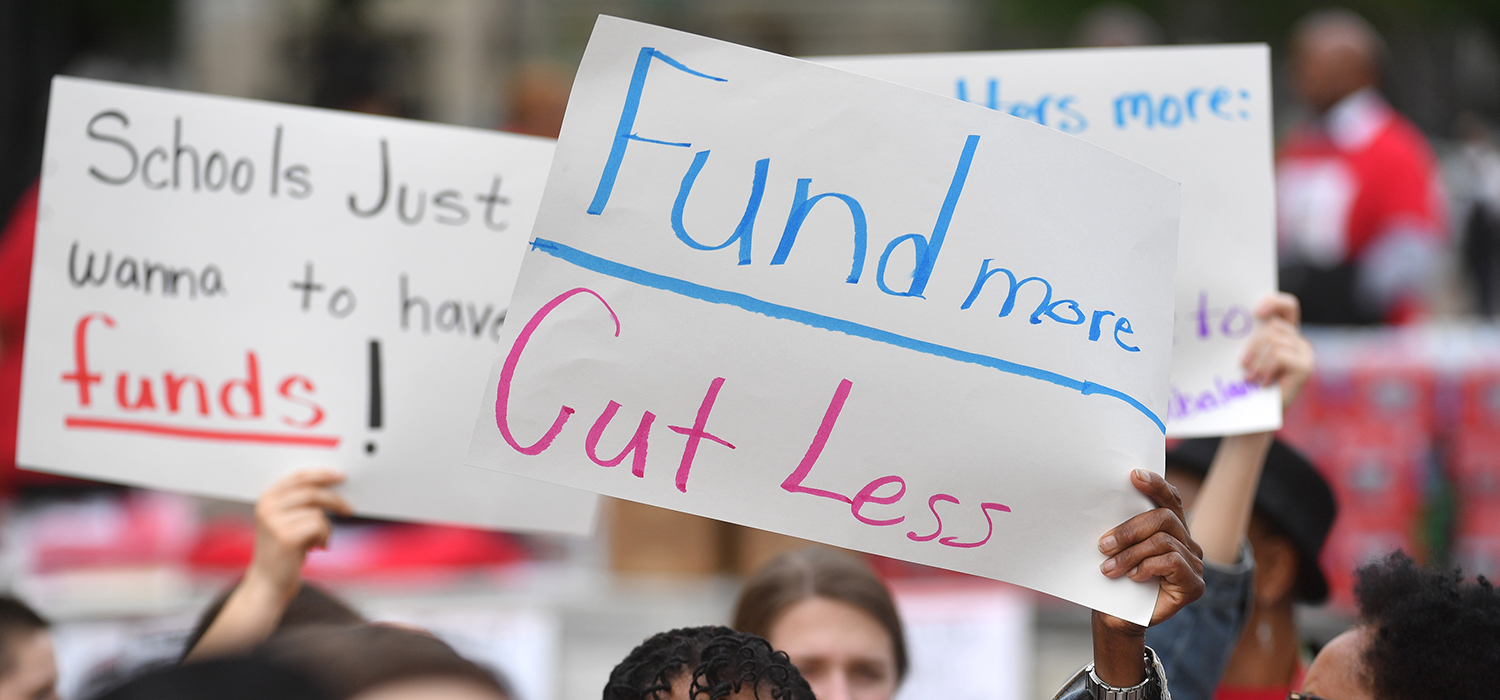
<p>Teachers, students, and members of a teachers union gather and rally against budget cuts and under funding of District of Columbia Public Schools at Freedom Plaza in Washington, DC on April 25, 2019. Teachers protested the under-funding of the District of Columbias low-income schools. This followed protests around the country over school funding and teacher pay. (Photo by Marvin Joseph/The Washington Post via Getty Images)</p>
State budget shortfalls resulting from the pandemic mean education funding is likely to suffer. To mitigate the harm of budget cuts, state legislators must think strategically. How cuts are made can have dramatically different impacts across different schools and students, and implementing equal-percentage cuts across districts is likely to further inequity.
Educational spending improves students’ educational attainment, increases wages, and reduces incidents of adult poverty. Further, research shows cutting education funding lowers test scores and rates of college going. In most states, state funding provides the bulk of the money spent on K–12 education, with federal dollars accounting for around 10 percent of total funding and local property taxes making up the rest.
During the pandemic, many advocates have called upon the federal government to allocate additional funds to help fill the gaps in state funding, as they did with the 2009 American Recovery and Reinvestment Act. But given current uncertainty about how much, if any, additional aid will come from the federal government, it is critical to examine the equity impacts of different types of state funding cuts.
Using a measure developed for earlier Urban Institute research, we modeled how different types of state funding cuts affect progressivity of state and local education funding in 49 states, excluding Hawaii, which is a single district. Our progressivity measure for each state is the difference between the average funding for poor and nonpoor students. (We focused on how funding flows to low-income students relative to others, but you can see similar analyses looking at students of color and students living in rural versus urban areas in the appendix.)
In the 2016–17 school year—the most recent year for which data are available—33 out of 49 states sent more state and local money to poor students than to nonpoor students. Many state funding formulas are designed to send more money to districts with low-income students to counteract often regressive local funding across the state. For example, Alaska, Wyoming, Ohio, Minnesota, New Jersey, and Massachusetts all spend more than $500 more per student in poverty than per nonpoverty student. Conversely, Connecticut and Illinois spend more than $500 more per nonpoverty student than per student in poverty.

To understand how progressivity for poor students may change with state funding cuts, we model three different types of state cuts:
- an across-the-board percentage cut of each district’s state aid (we model a 10 percent cut)
- a per student cut (we model a $650 decrease per student, decreasing state funding to $0 if states already provide less than $650)
- a cut targeted at low-poverty districts (we model the effect of cutting 20 percent of state aid from the weighted quartile of districts with the smallest shares of poor students, 15 percent from the second quartile, 10 percent from the third quartile, and a 5 percent cut from the quartile with the highest shares of poor students)
We compare the ratio of funding per student in poverty to the ratio of funding dollars per nonpoverty student before and after the funding cut (a value greater than 1 means students in poverty get more funding, on average, than their nonpoverty peers). In our graphs, the diagonal line is where states would fall if the cut had no effect on progressivity. States that would see a regressive effect fall below this line, and states that would see a progressive change are above the line.

We only model the first-order effects of these cuts on state and local funding; we do not model how local funding, or other aspects of state funding formulas, may change in response to these cuts or the effects of federal funds on progressivity.
We find percentage cuts have regressive effects on total state and local funding in almost all states and even move several states from allocating more money to low-income students to becoming regressive. This is likely because districts with higher shares of low-income students tend to get higher levels of state aid, so a percentage cut hits them harder. Percentage cuts do not have a consistent effect on the distribution of funding to white students relative to students of color. Similarly, there are contextually specific effects on rural and urban students. (More details are available in the appendix.)
Per student funding cuts have virtually no effect on our measure of funding progressivity. Targeted cuts—cutting a higher percentage from districts serving fewer students in poverty—made funding more progressive in every state and even caused some states to move from regressive to progressive funding (although, as with all cuts, every district would see less this year than they did previously). In practice, this may be politically challenging but could be done by cutting certain state aid programs but not others. Ohio recently responded to budget shortfalls by making larger cuts to affluent districts than to districts serving higher proportions of low-income students, such as the Cleveland School District.
Any reduction in K–12 funding harms students’ academic and labor market outcomes. If policymakers must implement cuts, the data suggest that to protect the most vulnerable populations, they should not just cut across the board.
Let’s help communities build more secure, hopeful futures.
Today’s complex challenges demand smarter solutions. Urban brings decades of expertise to understanding the forces shaping people’s lives and the systems that support them. With rigorous analysis and hands-on guidance, we help leaders across the country design, test, and scale solutions that build pathways for greater opportunity.
Your support makes this possible.