
<p>Photo by Martine Doucet/Getty Images.</p>
Keeping track of economically disadvantaged students is important for public school accountability and funding.
Now that free and reduced price lunch (FRPL) status as an indicator of economic disadvantage is in decline, stakeholders are turning to replacement measures. Given the extent of socioeconomic and racial segregation in most school districts, neighborhood-level measures of economic distress seem like an appealing, easy-to-measure alternative, but this seemingly intuitive solution does a bad job of predicting FRPL rates and performs worse in places where it is more critical to get it right.
For more than 15 years, policymakers and researchers have used participation in the National Student Lunch Program as a proxy for economic vulnerability among K–12 students. Eligibility for the program is based on the federal poverty level (FPL), with students living in households below 130 percent of the FPL getting free lunch and those living between 130 and 185 percent paying a reduced price.
But collection of school data on FRPL eligibility is becoming less common, in large part because of the advent of nationwide “community eligibility” rules in 2014–15. These rules allow schools and districts where more than 40 percent of students are eligible for FRPL to provide free lunch to all their students and stop collecting paperwork on FRPL status.
Though community eligibility can mean that more kids get free lunch, it also means that researchers and policymakers now lack an accurate count of the number of low-income students in a district or school.
In principle, the local 185 percent poverty rate among the student-age population should closely track school district FRPL rates if students attend schools in districts corresponding to their residence. We could therefore use neighborhood poverty measures to predict FRPL status. This is an appealing alternative given the wide availability of poverty measures at the census tract level from frequently updated government data sources, such as the American Community Survey (ACS).
In the figure below, I plot the share of students getting free and reduced-price lunch against the share of families with children ages 5 to 17 living below 184 percent of the FPL. The sample consists of all school districts in the mainland US that can be matched to tract poverty measures in the ACS for the 2009–10 school year, before the introduction of community eligibility. Each circle denotes a school district, with bigger circles corresponding to larger total district enrollment.
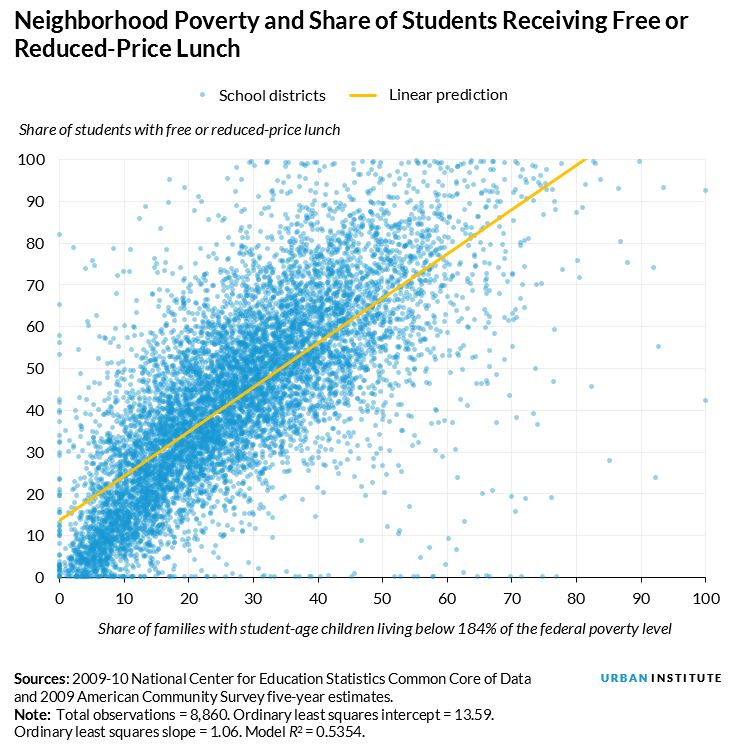
In 87 percent of districts, poverty rates underestimate FRPL rates. This means that using census data would likely result in an undercount of low-income students (at least if you believe FRPL is an accurate measure of student poverty).
Based on my analysis, districts with near-zero poverty according to ACS data have about a 14 percent FRPL rate, and for every 1 percentage-point increase in the poverty rate, the FRPL rate is expected to increase by an additional 1.06 percentage points. This means that in the community with the most low-income students, as measured by FRPL, the poverty rate is the least likely to provide an accurate picture of student poverty.
It is surprising that FRPL rates are consistently higher than poverty rates. Though some of this may be because some children attend schools outside their home district, I suspect other factors might be driving this variation.
Besides poverty, what drives free and reduced-price lunch rates?
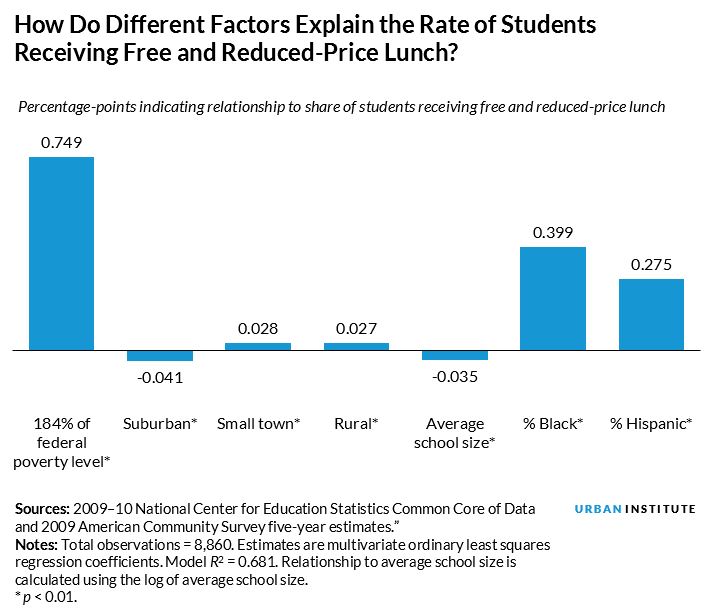
Local poverty rates explain about 54 percent of the variance in FRPL rates across communities. To see what factors might drive FRPL rates, I looked at several district characteristics, including geography, school size, and student demographics, controlling for the poverty rate. The results highlight a few important points:
- Urban-rural differences are present, but they are small.
- In districts with similar poverty rates, larger average school enrollment is associated with lower FRPL rates. One explanation is that larger schools don’t do as good a job getting forms back from disadvantaged students, allowing them to fall through the cracks and denying them a free lunch. But the evidence is also consistent with large schools enforcing eligibility criteria more strongly, such that free lunch rates are not inflated and FRPL rates and the 184 percent poverty rate follow each other more closely.
- Among districts with similar poverty rates, urban status, and average school size, a higher fraction of black or Hispanic students in the district is strongly predictive of higher free lunch rates. Two explanations could be driving this. On one hand, the poverty rates captured by survey data such as the ACS may systematically undercount poor families from these racial or ethnic minority groups, a concern that may be even greater for immigrant families. On the other hand, FRPL status might capture an unobserved component of economic vulnerability that is unmeasured by official poverty rates and is correlated with race or ethnicity but is observed by local school administrators.
Standard measures of neighborhood poverty are inadequate to match the existing indicator of student economic disadvantage. Though FRPL status is not a gold standard, it captures important aspects of student disadvantage, especially when measured consistently over time.
Researchers will have to look to data sources beyond local poverty rates to replace the FRPL measure. In doing so, we should keep in mind that poverty rates are especially inadequate at capturing some of the most vulnerable students, like students from racial or ethnic groups that have been historically underserved in the American public education system.
Let’s help communities build more secure, hopeful futures.
Today’s complex challenges demand smarter solutions. Urban brings decades of expertise to understanding the forces shaping people’s lives and the systems that support them. With rigorous analysis and hands-on guidance, we help leaders across the country design, test, and scale solutions that build pathways for greater opportunity.
Your support makes this possible.