
In 1977, Congress enacted the Community Reinvestment Act (CRA) to encourage banks to meet the credit needs of the communities in which they do business, especially in low- and moderate-income (LMI) areas where the median neighborhood income is less than 80 percent of the area median income (AMI). The CRA was also designed as a piece of civil rights legislation to overcome the effects of America’s history of redlining, under which lenders refused to lend to Black households, Latino households, and households of other ethnicities.
But the CRA at the national level applies only to banks and thrifts—entities regulated by the Federal Reserve, the Comptroller of the Currency, or the Federal Deposit Insurance Corporation—that provided most mortgage credit in 1977. The CRA does not apply to nonbanks, including credit unions and independent mortgage banks (IMBs).
As times have changed, so has the share of mortgage originations by nonbanks. In 2022, IMBs accounted for approximately 60 percent of all mortgage originations, including 75 percent of originations backed by Fannie Mae, Freddie Mac, the Federal Housing Administration, and other government agencies. Unlike most banks and thrifts, which have a geographic footprint and a defined community, most IMBs operate widely through various delivery channels, such as traditional retail branches, wholesale lending through mortgage brokers, and consumer direct through call centers.
To address these changes, Illinois, Massachusetts, and New York have adopted versions of CRA that now cover nonbank mortgage lenders, and California, Maryland, and Pennsylvania are considering adopting similar versions. In addition, federal bank regulators are updating CRA regulations.
Recently, we analyzed mortgage lending to LMI neighborhoods and borrowers. In this blog post, we show how the six states that have implemented or are considering implementing CRA rules for nonbanks have fared across bank and IMB mortgage lending to inform how similar policies could affect other states.
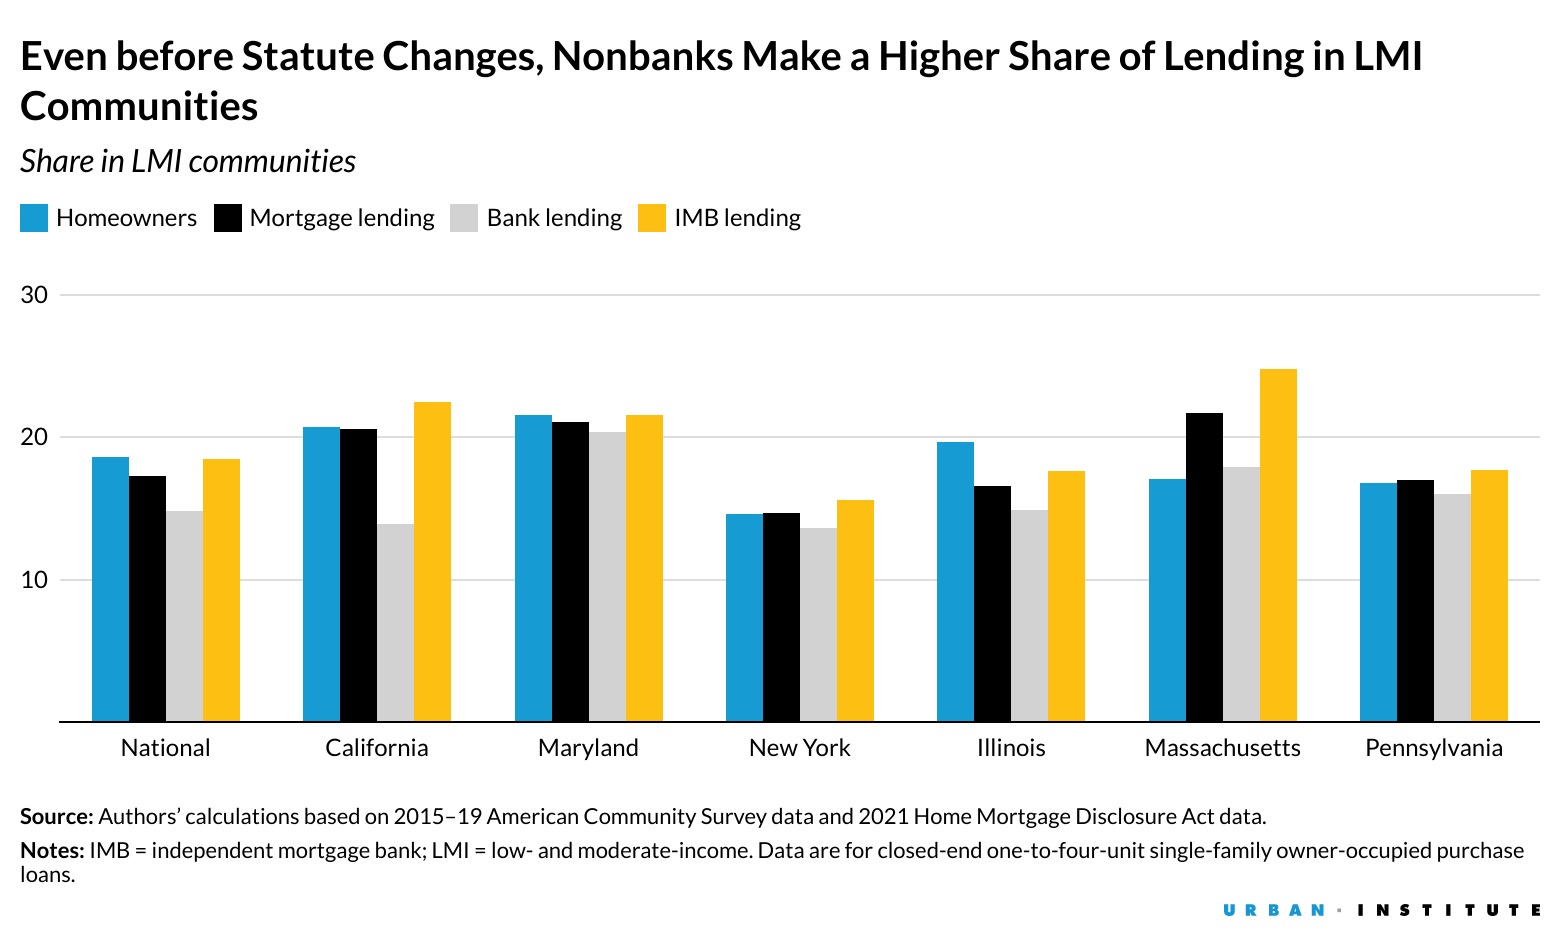
IMBs lend more to LMI neighborhoods than banks and match the existing homeowner share
For our analysis, we use the national share of homeowners in LMI communities as a benchmark because that share was used for the 2022 proposed CRA rules and because we would hope new lending would be at least proportional to the share of existing homeowners. We found that the total share of mortgage lending to LMI communities is 17.3 percent, nearly matching the 18.6 percent overall share of homeowners in LMI communities. But if we separate mortgage lending by IMBs and banks, we find that the IMB lending share in LMI neighborhoods is significantly higher than the bank share (18.5 percent compared with 14.8 percent).
This discrepancy in part stems from banks originating a lower volume of Federal Housing Administration lending, which disproportionately goes to LMI neighborhoods and LMI borrowers. To account for this, we separated government lending from conventional lending and found the IMBs also make a higher share of lending to LMI communities through the conventional lending channel.
If we look at the six states considering extending community reinvestment obligations to nonbanks, we observe a similar pattern. In most of the states, the share of mortgage lending adheres closely to the share of existing homeowners—slightly lower in Illinois, slightly higher in Massachusetts. By separating bank and IMB mortgage lending, we find that in every one of the six states, the IMBs are more active in lending to LMI communities.
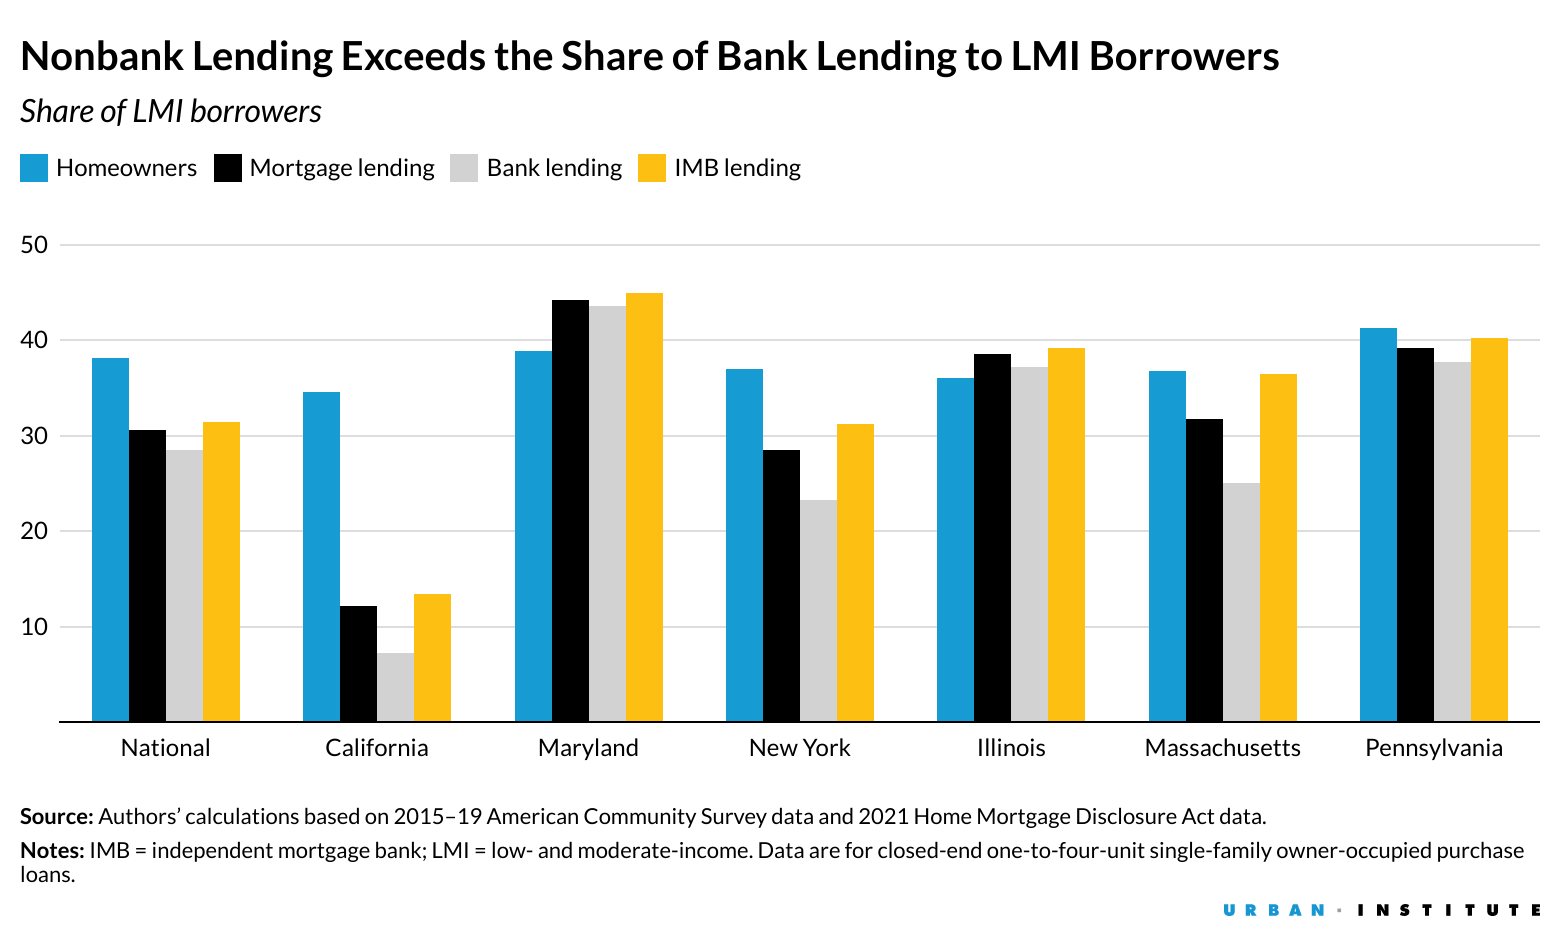
IMBs lend more to LMI borrowers than banks, but both lag behind the homeowner benchmark
Nationally, the share of mortgage lending to LMI borrowers (30.6 percent) falls well short of the share of LMI homeowners (38.1 percent). This pattern, in which mortgage lending lags behind the share of LMI homeowners, holds across four of the six states (Maryland and Illinois are the exceptions). In California, a state with very high housing prices, the gap between the share of mortgage lending to LMI borrowers and the share of LMI homeowners is particularly wide (12.2 percent versus 34.6 percent).
IMBs do a larger share of lending to LMI borrowers than do the banks (31.4 percent versus 28.5 percent), with the pattern holding true across all six states we looked at. The differences were particularly large in Massachusetts (36.5 percent versus 25.0 percent) and in New York (31.2 percent versus 23.3 percent). IMB lenders, while falling short at the national level, do exceed the share of LMI homeowners in Maryland and Illinois and match the share in Massachusetts.
Bottom line: CRA expansion to IMBs is a nuanced issue
With IMBs now originating more mortgages each year than banks subject to the CRA, some states have begun to include IMBs in state CRA regimes, while others are considering adopting new laws. Despite only Massachusetts currently examining IMBs under state CRA rules, IMBs are already more active in LMI lending than their CRA-covered bank counterparts in the other states we analyzed. We hope these data can help inform state policymakers as they continue deliberations and begin to consider enactment and implementation of new CRA statutes.
Let’s help communities build more secure, hopeful futures.
Today’s complex challenges demand smarter solutions. Urban brings decades of expertise to understanding the forces shaping people’s lives and the systems that support them. With rigorous analysis and hands-on guidance, we help leaders across the country design, test, and scale solutions that build pathways for greater opportunity.
Your support makes this possible.