Maybe you’ve heard about the scramble among researchers to preserve and monitor federal data sets. Maybe you know data drives everything from weather apps to business decisions to public health responses. But there’s another consequence to the erosion of these resources: when data disappears, so does the ability to craft effective, evidence-based policy.
Any kind of continuous, long-term population monitoring by local, state, or the federal governments is only possible because of federal data collections and public release of those datasets. Their consistency, comparability across geographies, and accuracy over time (what we consider to be critical elements of data resilience) provide the foundation for communities to track progress, evaluate impact, and adjust strategies. Without them, the ability to sustain and scale data-informed policy solutions is severely compromised.
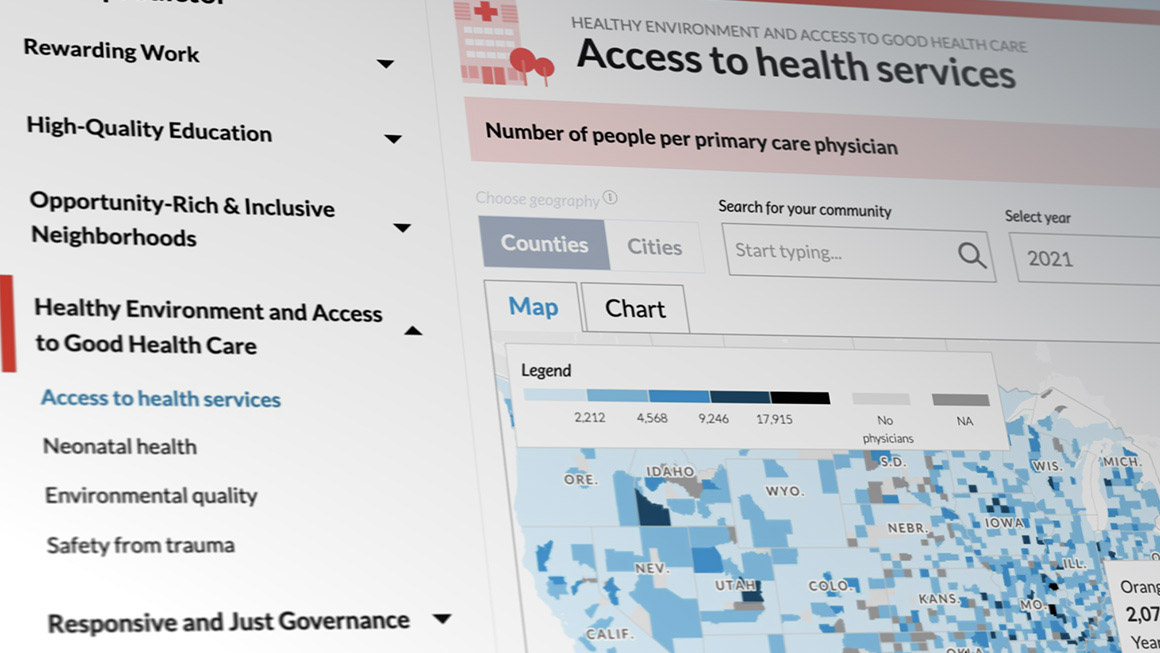
Take, for example, the Urban Institute’s Upward Mobility Data Dashboard. This tool visualizes 24 predictors associated with upward mobility for every county in the US and every city with more than 75,000 residents. It draws from a rich array of federal sources, including:
- Census Bureau: American Community Survey (ACS), County Population by Characteristics (CPB), and Population Estimates Program (PEP)
- Centers for Disease Control and Prevention: CDC WONDER data
- Environmental Protection Agency: AirToxScreen
- Federal Bureau of Investigation: National Incident-Based Reporting System (NIBRS)
- Department of Housing and Urban Development: Fair Market Rent (FMR) data
- Department of Education: Local Education Agency (LEA) data
These datasets power a dashboard that has helped communities across the country assess their residents’ upward mobility, develop cross-sector coalitions that set local strategies and goals, and—critically—track progress over time. For example:
- In Tulsa, Oklahoma, Representatives from ImpactTulsa and the George Kaiser Family Foundation built a locally grounded framework for upward mobility. Using the dashboard, they took an expansive view of economic mobility—layering data on life expectancy, hospital locations, and public transit routes to uncover correlations and identify areas for targeted investment. This approach helped align transportation, health care, and other city services to better support long-term prosperity.
- In San Mateo County, California, the Shared Prosperity Coordinating Council—a coalition of government agencies, nonprofits, and community leaders—developed the Economic Mobility Action Plan (EMAP) and their own data dashboard. Leveraging an assortment of rich data, the action plan integrates local population-level metrics, County administrative and programmatic services data, and qualitative insights from workshops and listening sessions, with federal benchmarks from the dashboard, ensuring the plan’s goals remain both aspirational and actionable. The local economic mobility data dashboard, set to launch in the second half of 2025, will track economic mobility conditions and help drive data-informed policy decisions made by local leaders to improve resident outcomes.
- In Kansas City, Missouri, Kansas City the Mobility Action Team (MAT), which comprises representatives from the city council, the Metropolitan Community College of Kansas City, and the Health Forward Foundation, worked together to understand challenges faced by Third District residents in jobs, housing, transportation, and education. After analyzing data from Urban’s dashboard, they found the city lagged behind peer communities in key areas like income opportunities and housing stability. To gather deeper insights, MAT conducted a community survey and hosted a data interactive at a neighborhood convention, where residents shared perspectives that reshaped the team's understanding. These efforts led to a proposal for a $500,000 city investment over two years to support upward mobility programs.
Another Urban Institute tool, the Financial Health and Wealth Dashboard, uses machine learning trained on patterns in the Survey of Income and Program Participation (SIPP) to estimate one-year ACS figures that illustrate financial health and wealth across cities and states. There are only a handful of ways to see wealth data at the local level, so machine learning based on a high-quality, longitudinal federal data set like the SIPP can be a rigorous way to create estimates.
Now, the Census Bureau currently plans to scale back the SIPP, potentially threatening the quality of the survey and the accuracy of these local estimates that policymakers rely on. The analysis the Financial Health and Wealth Dashboard provides contributed to understanding of local wealth disparities for organizations in Georgia, and ultimately to the nation’s first-ever local baby bonds pilot, launched last month.
When data disappear, we lose more than numbers—we lose the ability to see where inequities exist, to measure whether interventions are working, and to hold systems accountable. In short, we lose the ability to govern wisely.
As we look to the future, protecting and investing in federal data infrastructure must be a priority. Because good data isn’t just a research tool—it’s the foundation of effective policy innovation.
Let’s help communities build more secure, hopeful futures.
Today’s complex challenges demand smarter solutions. Urban brings decades of expertise to understanding the forces shaping people’s lives and the systems that support them. With rigorous analysis and hands-on guidance, we help leaders across the country design, test, and scale solutions that build pathways for greater opportunity.
Your support makes this possible.