
Urban Institute researchers generate a lot of data, and data, in our minds, are gateways to stories about people, places, and policies. In terms of data, 2014 has been a very busy year at Urban, and we continued to experiment with the way we tell stories with the data our researchers produce.
Here is a look at our favorite interactive, data visualization, and video-based projects of 2014:
|
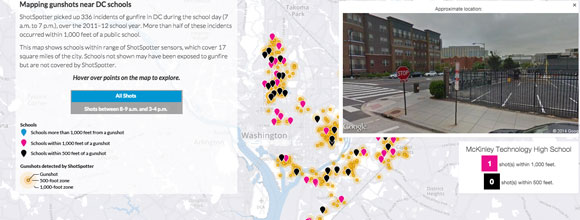
Everyday Violence: Gunfire Near DC Schools September 2014 |

|
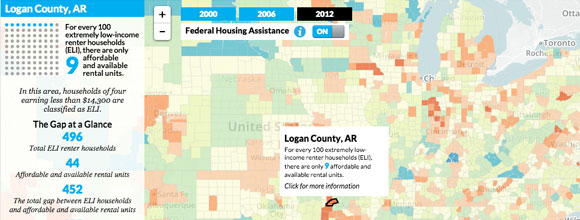
Crossroads: The Intersection of Housing and Education Policy October 2014 |

|
October 2014 |
|
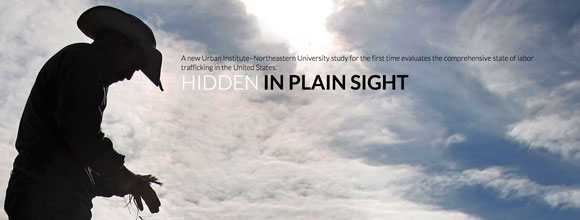
Hidden in Plain Sight: Labor Trafficking in the United States October 2014 |

|
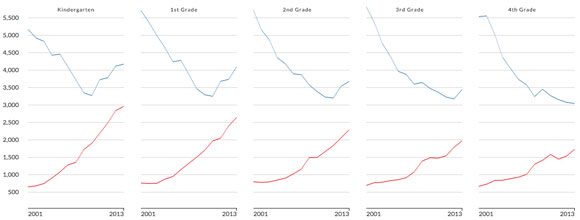
A New View of the Housing Boom and Bust January 2014 |

|
The Hustle: Economics of the Underground Commercial Sex Industry March 2014 |

|
January 2014 |
|
March 2014 |

|
May 2014 |

|
May 2014 |

|
May 2014 |
|
March 2014 |

|
December 2014 |
|
December 2014 |

|
April 2014 |
Let’s help communities build more secure, hopeful futures.
Today’s complex challenges demand smarter solutions. Urban brings decades of expertise to understanding the forces shaping people’s lives and the systems that support them. With rigorous analysis and hands-on guidance, we help leaders across the country design, test, and scale solutions that build pathways for greater opportunity.
Your support makes this possible.