<p>(Afton Almaraz/Getty Images)</p>
The COVID-19 pandemic shifted millions of Americans into working from home and, in the process, reduced ridership dramatically on the nation’s bus and rail networks. Yet, in every US community, essential workers—largely people of color and people with low incomes—continued to travel to jobs, providing communities access to health care, public services, and groceries, among other important needs.
To understand how transit ridership changed during the pandemic, I examined changes in boardings at subway and elevated stations in several US metropolitan areas and compared them with neighborhood-level demographics.
Though almost every station I studied saw fewer riders in 2020 compared with 2019, changes varied tremendously based on local characteristics, as neighborhoods with large Black populations, many households with low incomes, and more residents with lower levels of education lost fewer riders than other communities. Stations in employment-dense areas also lost considerably more riders than those in residential zones—likely because white collar workers with employment in downtowns were disproportionately able to work from home.
Moving forward, transit systems can use these ridership data to prioritize their core riders: those who kept riding, particularly those with lower incomes and people of color.
Transit ridership changes varied based on local demographics
Before the pandemic, transit riders were disproportionately (PDF) people of color and people with low incomes. Essential workers who continued to commute during the pandemic also disproportionately shared those characteristics.
These trends play out in data from across the country. Boston bus routes running through neighborhoods where people of color predominately live held on to more of their ridership during the pandemic than other neighborhoods. Denver bus and rail stops that added riders had lower median household incomes than stops that lost riders. And nationwide, transit continued to be more popular in communities with more people of Hispanic descent and lower incomes.
To analyze pandemic-era travel trends, I collected average weekday, station-level ridership data in 2019 and 2020 from the heavy rail systems (sometimes called subways, elevateds, or metros) operated by Bay Area Rapid Transit in San Francisco, the Chicago Transit Authority, the Metropolitan Transportation Authority in New York City, and the Washington Metropolitan Area Transit Authority in the DC region.
These agencies operated four of the five (PDF) most-used US heavy rail systems in the prepandemic period, together carrying 87 percent of national heavy-rail riders and a third of all US transit riders in 2019. Among the more than 700 stations in these systems that were open in both years, all lost ridership. (Changes in ridership may reflect changes in service, but I do not examine that issue here.)
But that ridership loss varied. I compared station-level data with US Census Bureau data about demographics and jobs in areas within a half mile of stations. Communities with large Black populations, low median household incomes, small low-wage populations, and small college-educated populations each lost fewer riders on average than communities with few Black residents, high incomes, and many college-educated residents.

In the quarter of stations in areas with the highest median household incomes, the average stop lost 70 percent of its riders between 2019 and 2020. On the other hand, the quarter of stations in areas with the lowest incomes lost just 55 percent of their riders. Similarly, those communities with the largest share of Black residents lost 58 percent of their 2019 riders, compared with a 63 percent decline for those with the smallest share.
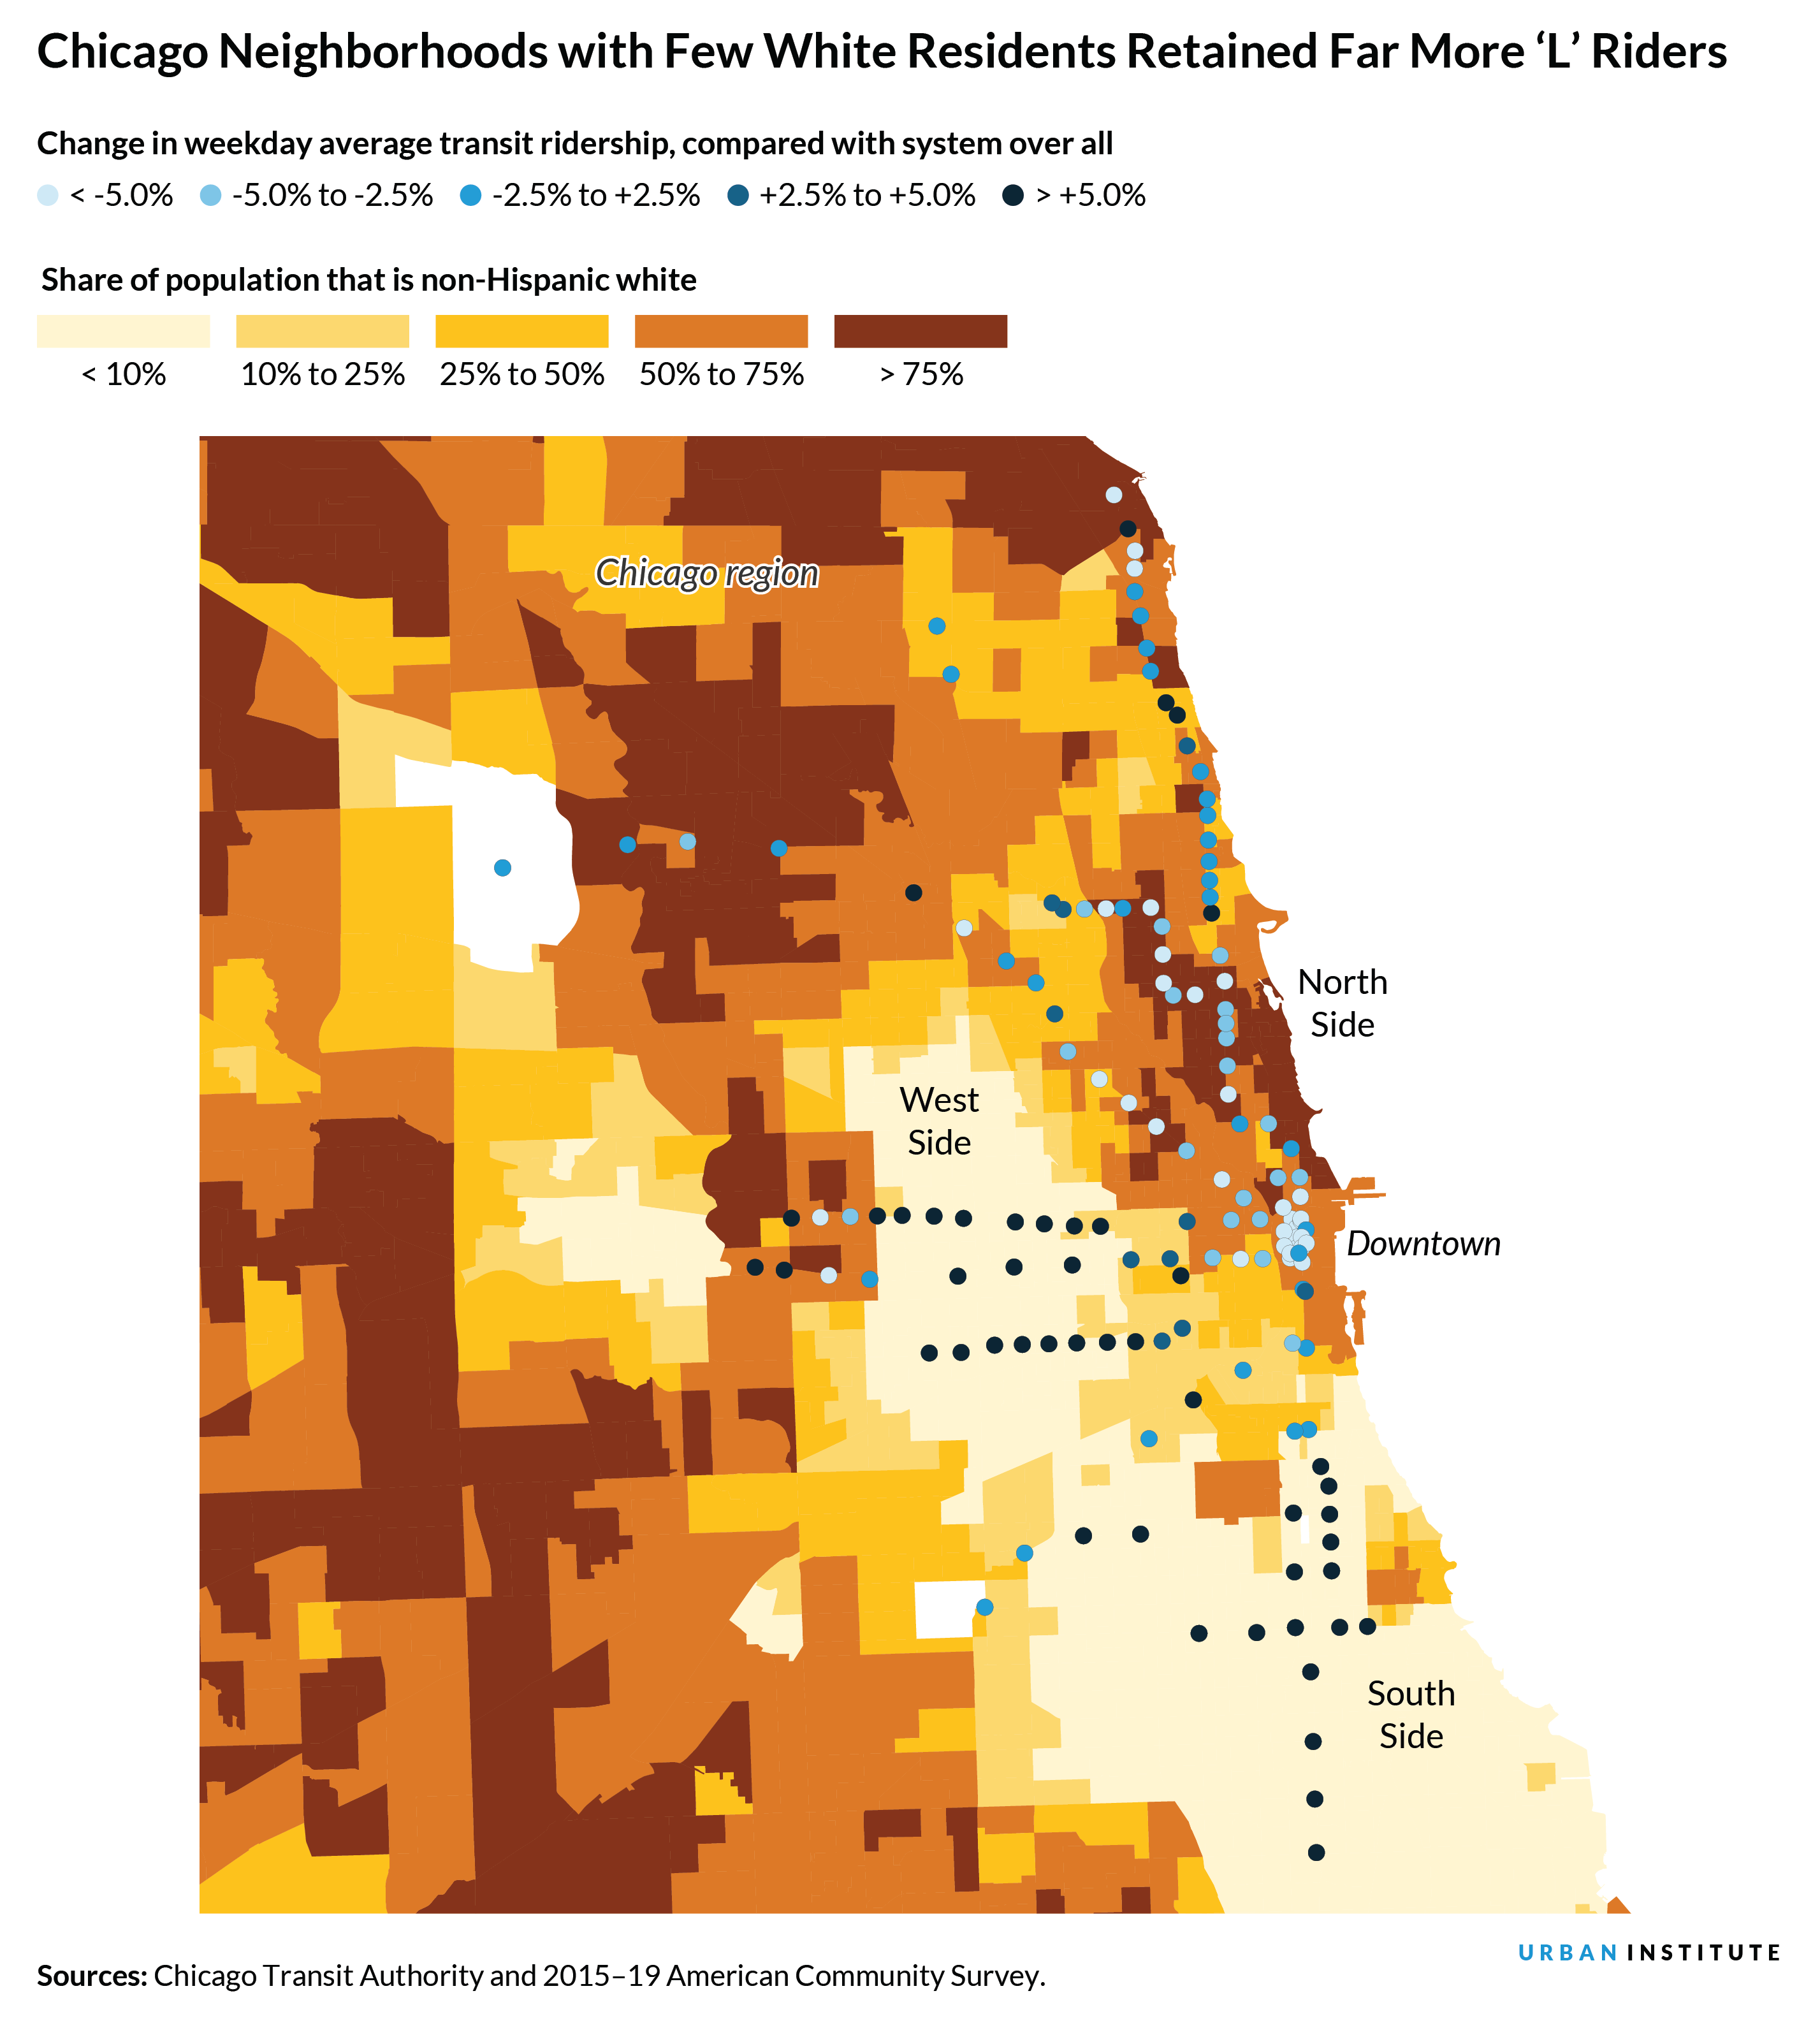
In Chicago, neighborhoods with higher shares of residents of color—such as the communities of largely Black and Hispanic residents on the city’s South and West Sides—retained far more ridership at their ‘L’ stations than those in communities where white families predominate.
Similar trends played out in the other regions. In the DC area, neighborhoods with lower median household incomes, such as in Prince George’s County in suburban Maryland, retained more riders than those with high incomes. And in New York City, stations in neighborhoods with higher shares of people with a college education—such as those in much of Manhattan—had a much larger decline in ridership than those with low levels of college education.
Employment centers suffered large ridership losses
In addition to significant ridership variation based on the demographics of neighborhood stations, stations near employment hubs also saw large changes in ridership. Though stations with at least 30,000 jobs within the surrounding half mile represent fewer than 21 percent of all stations in the four heavy rail systems I analyzed, they were core generators of ridership, accounting for more than half of prepandemic boardings in New York, 44 percent in the Bay Area, 38 percent in the DC region, and 28 percent in Chicago.
With the shift to remote work, these stations lost more riders than predominately residential stops. On the New York City Subway, stations with many jobs nearby lost 67 percent of their riders between 2019 and 2020, compared with a 57 percent decline for other stations. Similar trends were apparent for all the transit networks I studied.

Supporting a ridership recovery
Transit systems throughout the US face considerable obstacles to bringing riders back. New York City Subway ridership, for example, remains 40 percent below prepandemic levels.
But pandemic period travel trends indicate clearly that core riders—people with low incomes, people of color, and people with fewer years of education—used transit and will most likely continue. These data provide an opportunity for agencies to understand the travel demands and needs of riders who are most likely to continue using services—pandemic or not. By redesigning routes to prioritize social equity—which some transit agencies are doing already—and by making transit more available in high-ridership neighborhoods, cities can maximize access for those who need it most.
Let’s help communities build more secure, hopeful futures.
Today’s complex challenges demand smarter solutions. Urban brings decades of expertise to understanding the forces shaping people’s lives and the systems that support them. With rigorous analysis and hands-on guidance, we help leaders across the country design, test, and scale solutions that build pathways for greater opportunity.
Your support makes this possible.