
<p>Photo by Momo Productions via Getty Images.</p>
According to last week’s report (PDF) from the US Census Bureau’s Housing Vacancy Survey (HVS), the US homeownership rate increased slightly from Q3 to Q4 of 2019, from 64.8 to 65.1 percent. This is the highest recorded level since 2013.
Meanwhile, the black homeownership rate increased from 40.6 percent in Q2 to 42.7 percent in Q3 to 44.0 percent in Q4. This is the highest recorded level since 2012 and represents an 8 percent increase (or 3.4 percentage points) over six months.
We’ve been talking about the crisis in black homeownership for some time, so an 8 percent increase seems like great news.
But determining the US homeownership rate is complicated, and understanding increases and decreases in black homeownership requires looking at the full picture of the data.
Comparing two different measures of homeownership
If you look up the US homeownership rate, you’ll find at least five numbers ranging from 63.8 to 66.9 percent. Most of these data points come from one of the five trusted sources in the table below:
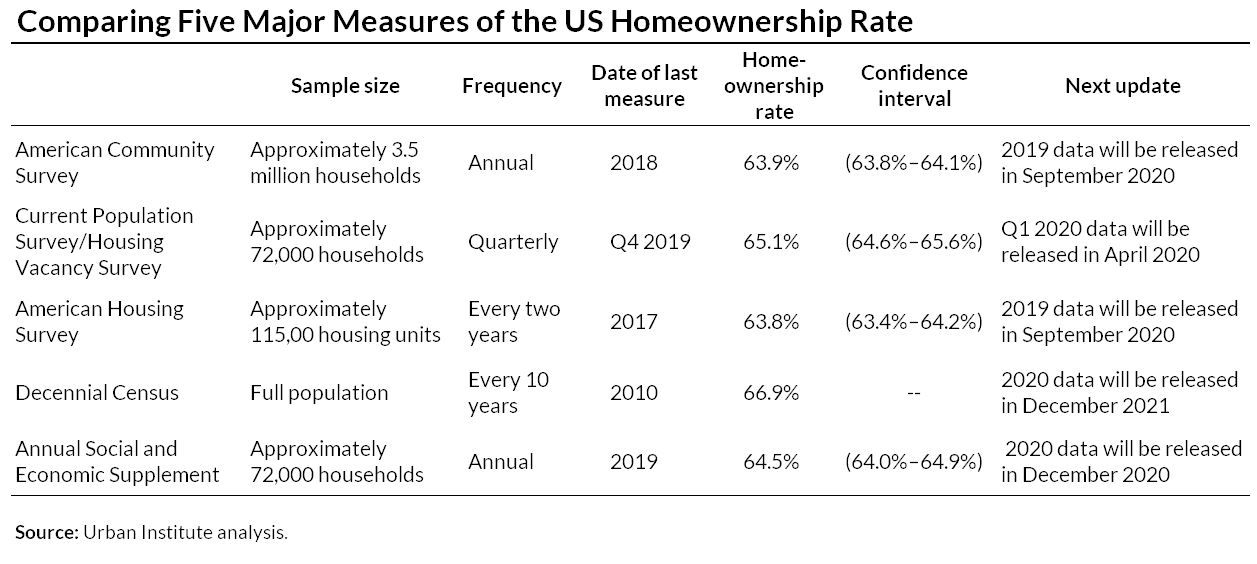
To illustrate differences between homeownership measures, we can look at the two most frequently cited measures, the American Community Survey (ACS) and the HVS. The HVS is so frequently cited because it’s the most regularly updated homeownership rate. But because of its volatility, quarterly fluctuations don’t always indicate actual shifts in homeownership.
First, an explanation of some key terms:
- The Census Bureau makes estimates (PDF) based on the population sampled.
- Because samples do not perfectly represent the full population, these estimates have some uncertainty.
- The margin of error attempts to gauge this uncertainty by showing how much the estimate varies from the true measure of the population.
The Census Bureau reports the margin of error for the HVS at the 90 percent confidence level. By adding and subtracting the margin of error from the estimate, we can create a confidence interval in which there is a 90 percent chance that the true value for the population lies within the interval.
The smaller the sample, the larger the uncertainty.
The graph of the homeownership rate from the HVS below illustrates these concepts. The dotted lines represent the upper and lower boundary of the 90 percent confidence interval for the most recent estimate—in this case, Q4 of 2019.

These lines are useful when looking at trends over time. Although it looks like there was a sharp increase in homeownership at the end of 2018 followed by a decline, we can see from the confidence interval that the true value may have been relatively consistent with previous quarters.
We can now use these concepts to compare the ACS, a large annual survey, with the HVS, which is based on a much smaller quarterly survey.

Some of the biggest fluctuations in the HVS homeownership rate do not correspond with decreases or increases in the ACS homeownership rate. The confidence interval on the ACS is smaller because of the much larger sample size. For this reason, we rely on the ACS as our benchmark for homeownership.
Measuring the homeownership rate requires balancing the frequency of the estimate and the level of uncertainty you are willing to tolerate.
More timely measures such as the HVS have merit, but they require more analysis to determine if we are seeing a real trend or just picking up the volatility in the series.
One way to combat this uncertainty is to compare more than two quarters of data at a time. For instance, instead of looking at the differences from one quarter to the next, look for several consecutive quarters of increases or decreases, or compare the current estimate to the estimate from one year ago, two years ago, and three years ago.
What do the latest numbers say about homeownership?
The Q4 2019 HVS homeownership rate of 65.1 percent represents an increase over two consecutive quarters. While this is the highest recorded level since 2013, it is within the confidence interval for several recent quarters, and the Q4 rate tends to be higher because of seasonal fluctuations.
There has been a decrease from Q4 of each year to Q1 of the following year 15 times since 2000, and it has been constant in four years. There has not been an increase from Q4 to Q1 over this period. Even so, there has been a sustained uptick in the homeownership rate since the troughs of 2015 and 2016.
The HVS-reported black homeownership rate of 44 percent for Q4 2019 also represents two consecutive quarterly increases from 40.6 to 44 percent. While this is the highest recorded level since 2012, it is also within the confidence interval for several recent quarters. And we know that the fourth quarter of the year tends to be higher due to seasonal fluctuations.
Even if the 44 percent were correct, an enormous gap of 29.7 points remains between the black and white homeownership rates, a gap larger than the 1960 gap, before the Fair Housing Act was passed. Much work still needs to be done.
More about the different measures
The decennial census
The census is the gold standard in terms of accuracy because it includes the entire nation and does not extrapolate. But because the census is completed only once every 10 years, it may miss big fluctuations in homeownership, such as the increases and subsequent declines we saw in the housing boom and bust of the early 2000s.
The American Community Survey
The ACS is the largest survey that asks about homeownership, sampling around 3.5 million households annually. From this sample, we can derive estimates (and margins of error) to get a reasonable measure of homeownership.
ACS data are released in September for the prior year. The enormous amount of time required to collect and process the data yields a significant time lag, so researchers are not always using the most up-to-date estimate.
The Housing Vacancy Survey
The HVS is a product of the Census Bureau’s Current Population Survey (CPS) and is the most frequently updated indicator, released quarterly. But the survey has a smaller sample size: approximately 72,000 households. This yields larger margins of error, meaning estimates tend to be more volatile.
In addition, there is some seasonal variation, with Q4 generally having the most variation of the year.
The American Housing Survey and the Annual Social and Economic Supplement
The AHS and the Annual Social and Economic Supplement from the CPS also contain information on homeownership. These surveys have smaller sample sizes than the ACS, and the AHS is only produced every other year.
It’s useful to have a variety of homeownership measures—some released more often, and others released less frequently but with a higher degree of certainty. Understanding these differences is critical to develop a clear understanding of homeownership trends in the US today.
Let’s help communities build more secure, hopeful futures.
Today’s complex challenges demand smarter solutions. Urban brings decades of expertise to understanding the forces shaping people’s lives and the systems that support them. With rigorous analysis and hands-on guidance, we help leaders across the country design, test, and scale solutions that build pathways for greater opportunity.
Your support makes this possible.