
<p>Eddie Rodriguez and other City of Hialeah employees hand out unemployment applications to people in their vehicles in front of the John F. Kennedy Library on April 8, 2020 in Hialeah, Florida. The city is distributing the printed unemployment forms to residents as people continue to have issues with access to the state of Florida’s unemployment website in the midst of widespread layoffs due to businesses closing during the coronavirus pandemic. (Photo by Joe Raedle/Getty Images)</p>
Unemployment rates increased in 32 states and the District of Columbia in March. Total employment fell the most, year-over-year, in Vermont (-2.4 percent), West Virginia (-1.7 percent), and Louisiana (-0.9 percent).
With businesses shuttered throughout the country and unemployment claims off the charts, we already knew the economic pain resulting from COVID-19 was widespread and deep. But the data on employment and earnings released by the US Bureau of Labor Statistics (BLS) today provide a 50-state picture, and we think the best way to see what’s happening is with the State Economic Monitor.
Our interactive data tool lets you compare the trajectory of unemployment rates, employment totals (private and public), and earnings across states and time.
State and local governments will rely on these employment and earnings data as they make tough decisions about health care, housing, education, and more.
What the data show
In March, 17 states saw total employment decline over the year compared with a year ago. Only seven states saw declines in February. Further, states like California, where Governor Gavin Newsom issued the nation's first stay-at-home order and closed all nonessential businesses on March 19, and Maryland, where Governor Larry Hogan ordered restaurants, bars, gyms, and theaters to close on March 12, did not see net decline in employment, but their job growth collapsed between February and March. California’s annual job growth fell from 1.6 percent in February to 0.9 percent in March and Maryland’s fell from 1.2 percent to 0.2 percent.

These numbers paint an alarming picture of how the COVID-19 pandemic and government efforts to address the public health crisis crashed into state labor markets, but they understate the severity of the economic collapse.
The BLS data are imperfect (PDF) because they capture a month’s worth of data in an environment where seismic changes are occurring daily. The unprecedented spike in weekly unemployment insurance claims show how fast this is moving. And because of how employment and unemployment are defined, they also do not capture workers who were furloughed or involuntarily reduced from full-time to part-time work.
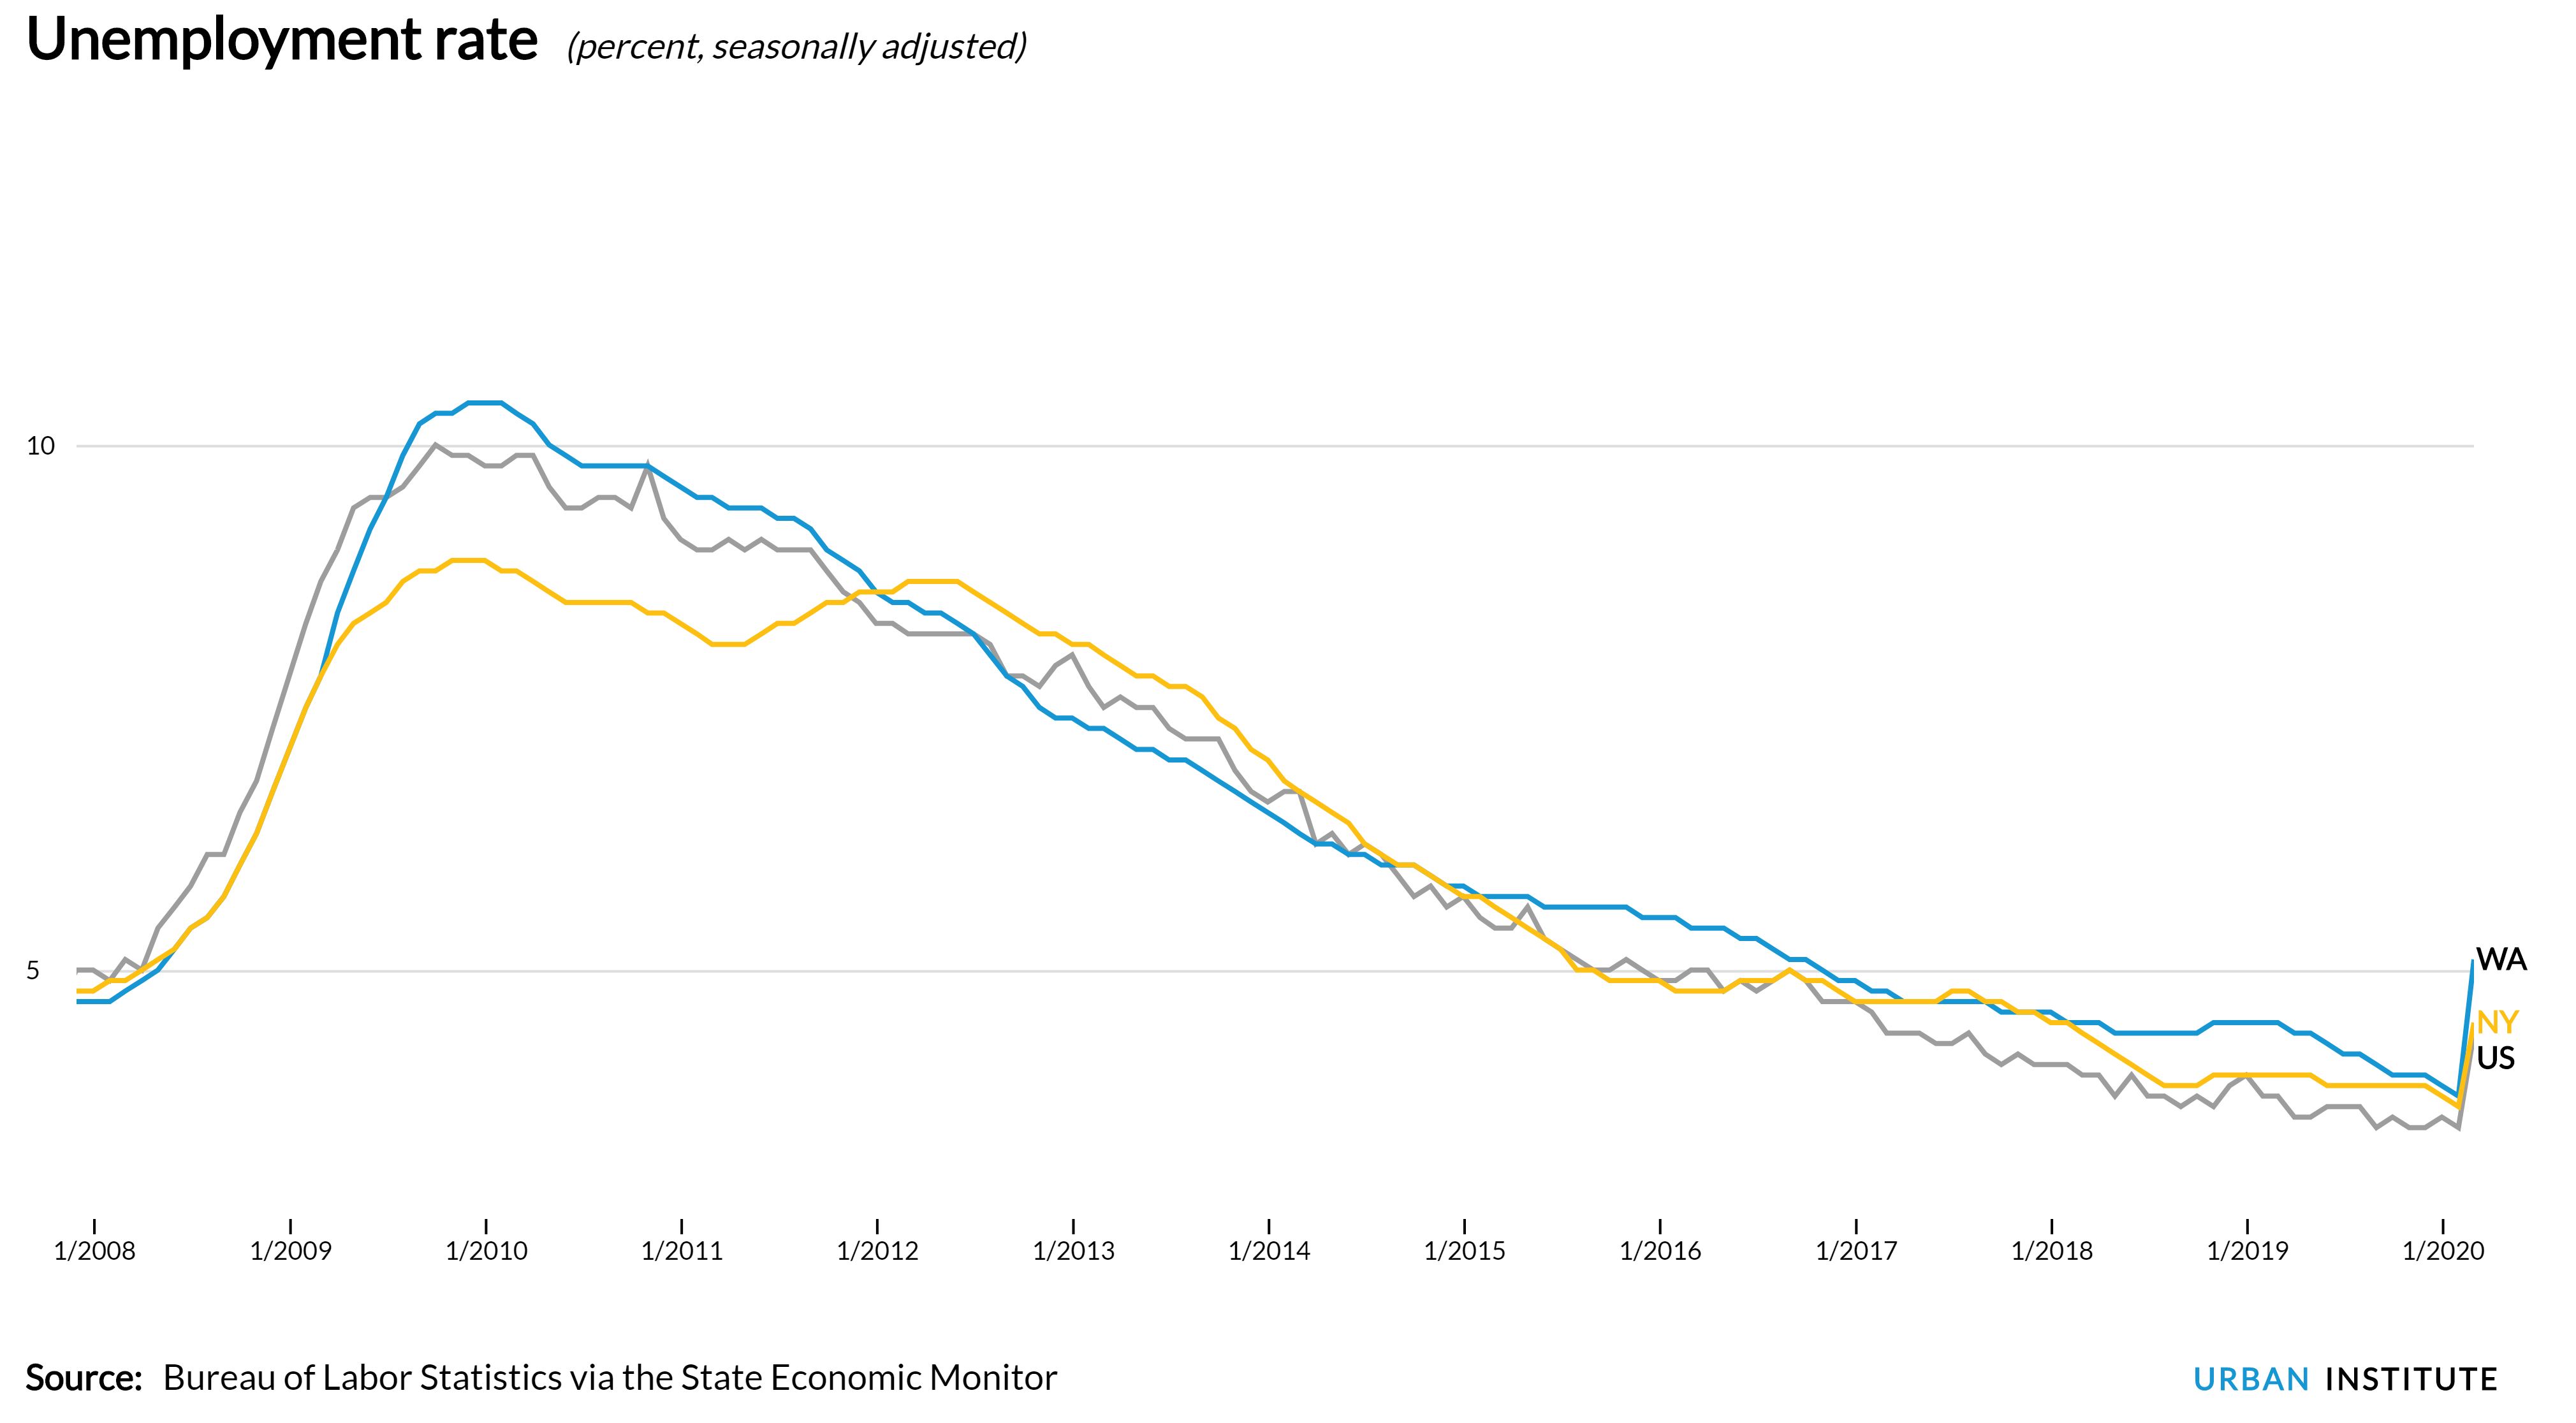
Still, the March data upended months of low unemployment in states across the country. In fact, unemployment rates in six states had reached a 40-year low in February—including New York and Washington, two states where the virus hit earliest.
Other variables affect the severity of the fallout in each state, including the availability of government jobs. In the District of Columbia, 30 percent of all workers are employed by the federal or local government, compared with only 12 percent of workers in Pennsylvania.
Public-sector jobs are (for now) more protected from layoffs than private-sector jobs; only nine states saw a year-over-year decline in public employment, while 18 states saw a decline in private employment. However, if collapsing tax revenue and inadequate federal assistance force states to make budget cuts, public jobs may also disappear.
Key industries also affect these indicators. States that rely heavily on the accommodation, recreation, and restaurant industries, such as Hawaii, saw a higher-than-average private employment decline over the year, though weekly earnings growth remained positive.
Racial inequities also play a role. Early data indicate that Black people comprise a disproportionately high share of COVID-19 cases and deaths in Illinois, New York, North Carolina, and others. States with the highest shares of Black households, such as Louisiana, saw a higher-than-average decline in total employment, jumping from 5.2 percent in February to a nation-wide high 6.9 percent in March.
How states and Congress are responding
At the moment, most states are correctly focused on effectively fighting the pandemic by limiting the operation of restaurants and bars, canceling large events, and issuing stay-at-home orders. All of these public health decisions will save lives but will also contribute to increases in unemployment.
Other legislative measures, such as eviction protections or rent freezes, will hopefully lessen the severity of the economic burden over the long term. But they likely won’t directly improve these economic indicators anytime soon.
As such, these numbers are likely to get worse in the months ahead. And because of fiscal constraints, states will be left with two options for turning the economic tide: finding novel solutions (likely in the form of new tax increases or budget cuts) and relying on federal assistance.
The $2 trillion Coronavirus Aid, Relief, and Economic Security Act, in addition to the first- and second-phase federal aid packages, provide some fiscal relief. But this will not be enough to cover the unprecedented revenue downturn most state and local governments will face.
COVID-19’s long-term economic effects on states remain highly uncertain, but we will continue to track state-level employment, earnings, housing, and gross domestic product data with the State Economic Monitor throughout this crisis and into the recovery. As always, our goal is to provide access to the state economic data needed for understanding and addressing the tough policy decisions ahead.
Let’s help communities build more secure, hopeful futures.
Today’s complex challenges demand smarter solutions. Urban brings decades of expertise to understanding the forces shaping people’s lives and the systems that support them. With rigorous analysis and hands-on guidance, we help leaders across the country design, test, and scale solutions that build pathways for greater opportunity.
Your support makes this possible.