Rates of upward mobility have stagnated or worsened in many communities and among certain groups of people nationwide in recent decades. Recent research from Opportunity Insights and the Urban Institute shows that racial inequities in income and other factors that affect mobility persist, and the key supports people need to reach long-term prosperity fall short in many communities, especially for people of color and people with low incomes.
Local leaders across the country want to better understand these inequities and help all people thrive. A new tool, the Upward Mobility Data Dashboard, helps them do that.
The dashboard provides data on 24 predictors the Upward Mobility Framework identifies as strongly associated with upward mobility. These data, called Mobility Metrics, are available for every county and more than 400 cities in the US. The dashboard also includes charts and other analytical tools that assist with interpreting and using the data.
To show how people can use the dashboard and other resources to learn more about mobility in their own communities, I investigate three predictors of upward mobility in the five largest US cities: New York, Los Angeles, Chicago, Houston, and Phoenix.
Why should we examine upward mobility in the largest US cities?
All but 12 of the country’s 50 largest metropolitan areas have experienced worsening rates of economic mobility for people in low-income families over the past 15 years, according to the Opportunity Atlas, a collaboration between Opportunity Insights and the US Census Bureau. Among the five most-populous cities, only Houston has seen an improvement in income at age 27 for people growing up in the 1990s versus the 1980s (1.1 percent).
Almost 1 in every 10 people living in an incorporated place lives in one of these five cities, so how they are doing matters to mobility in the country as a whole. Upward mobility looks different but has some common trends across these five cities, as demonstrated in the charts below from the data dashboard.
Leaders in these cities and other communities can use insights from this analysis, the dashboard, and additional resources to advance solutions that increase upward mobility for all residents, especially those excluded from prosperity by structural inequities.
Racial and ethnic disparities in household income persist at all income levels
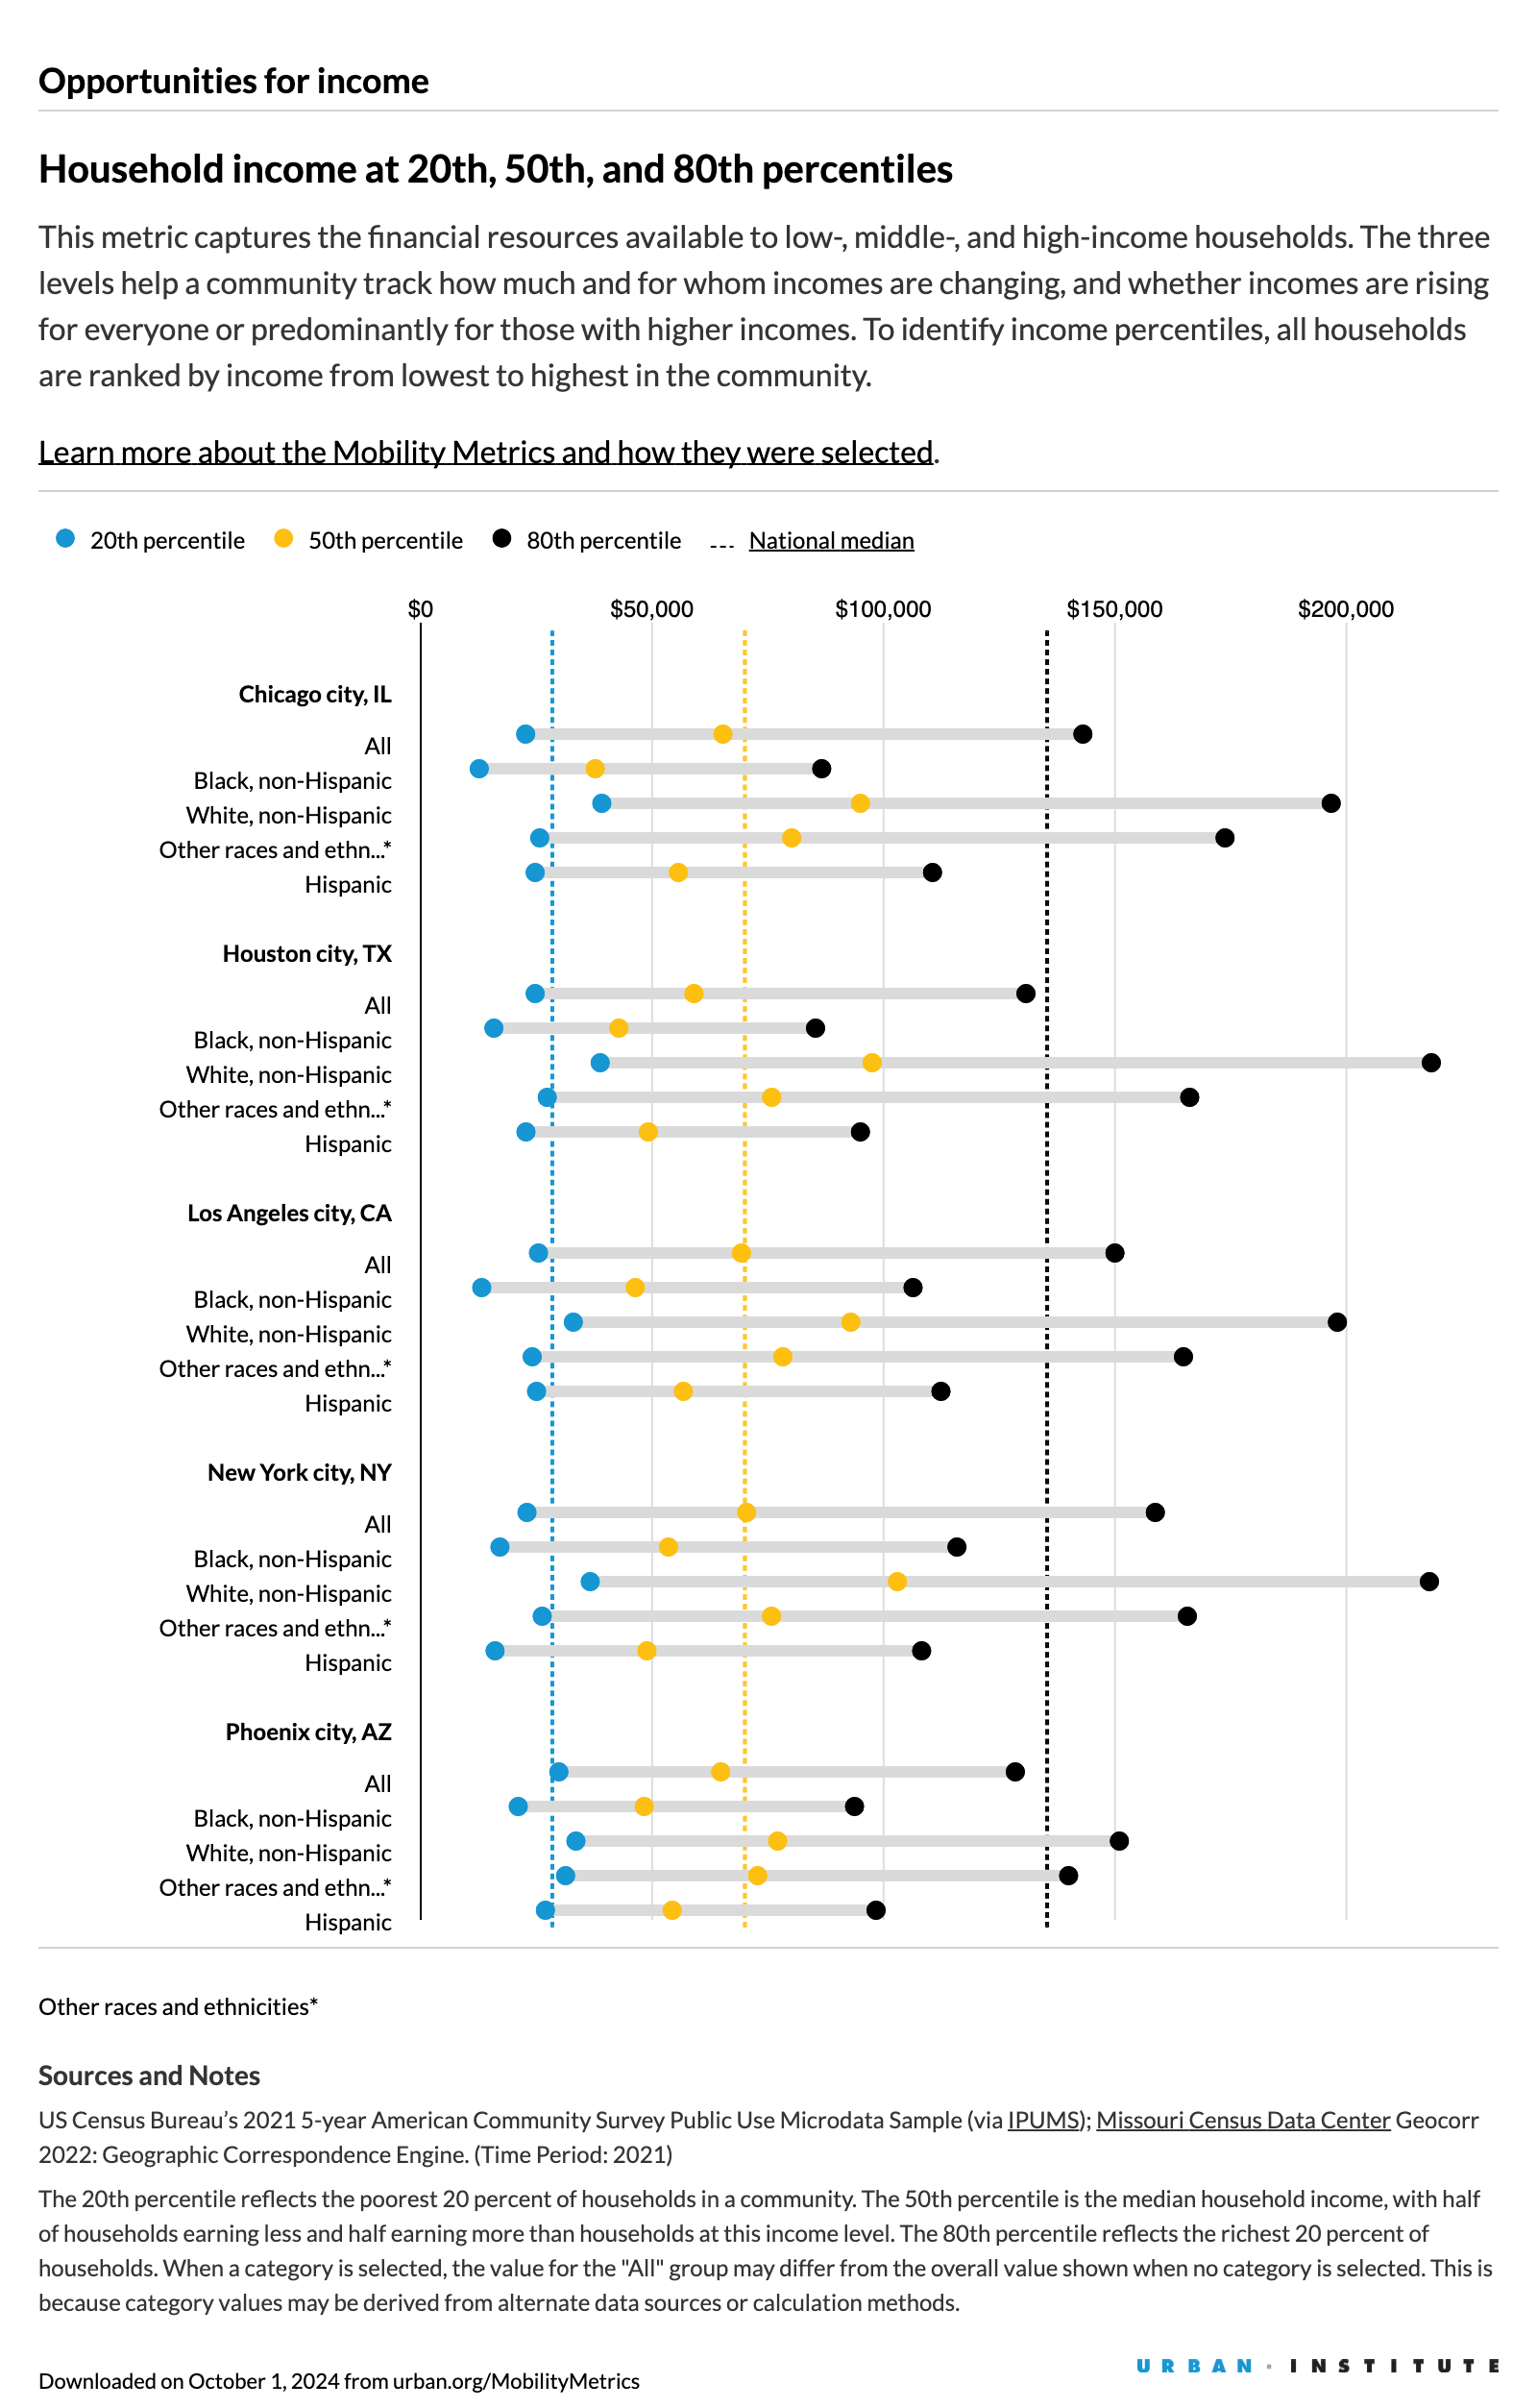
Opportunities for income are a strong predictor of economic success and tied to improved academic and health outcomes. To measure this predictor, its Mobility Metric captures household income at the 20th, 50th, and 80th percentiles.
In all five cities, incomes are at or a little below the national medians for households with low and middle incomes. However, in Chicago, Los Angeles, and New York, incomes are above the national medians for households with high incomes. In all five cities, white households’ incomes are above national medians for all income levels, while Black and Latine households’ incomes are below national medians at all income levels. (Though the charts below use “Hispanic” to align with categories in the underlying datasets, I use the gender-neutral term “Latine” throughout for greater inclusivity.)
These racial and ethnic disparities are most apparent among households with high incomes: income at the 80th percentile for white households is at or above $200,000 in all five cities except Phoenix, while Black and Latine households’ incomes at the 80th percentile are under $115,000 in all five cities.

VIEW THIS CHART IN THE DASHBOARD
Black and Latine students are more likely to attend high-poverty schools
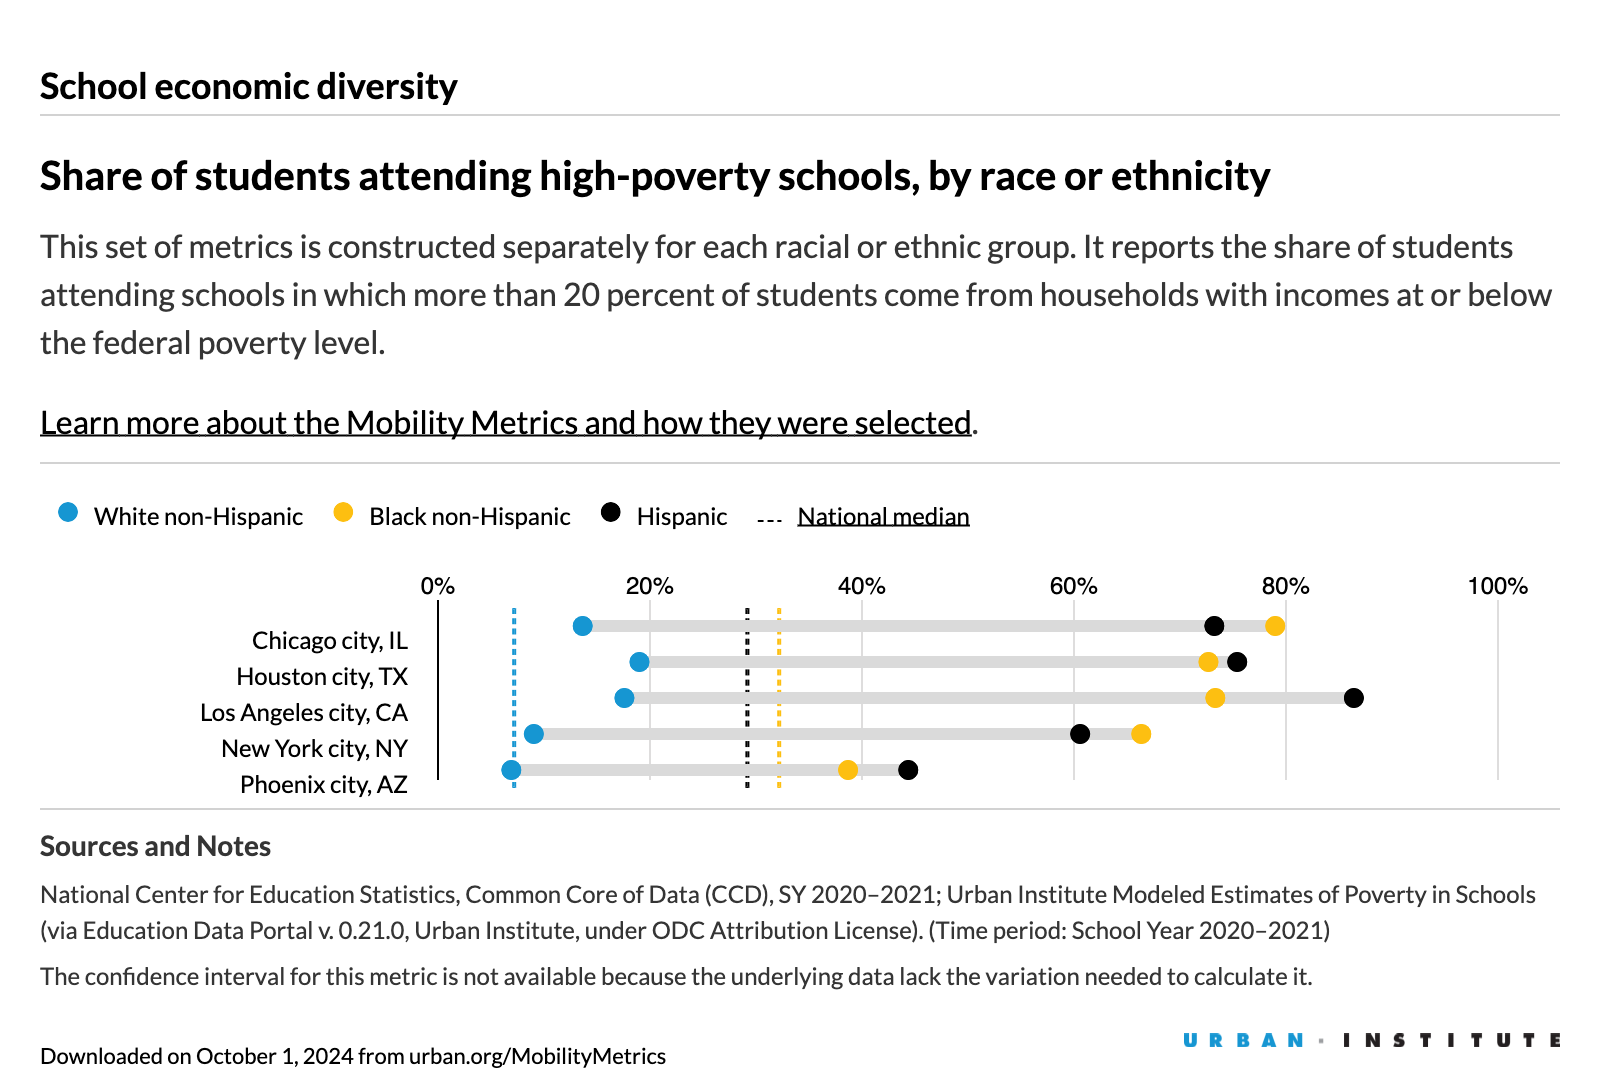
School economic diversity is an important predictor of upward mobility for children of color and children from low-income households, who tend to achieve better outcomes when they attend more-diverse schools. The Mobility Metric for this predictor captures the share of students attending high-poverty schools, where more than one-fifth of students live below the poverty line.
Black and Latine students in all five cities experience relatively high levels of economic segregation. In all of the cities except Phoenix, 60 percent or more of these students attend high-poverty schools. This is much higher than the national medians for Black and Latine students (32 percent and 29 percent).

VIEW THIS CHART IN THE DASHBOARD
Affordable and available housing options are lacking for people with low incomes
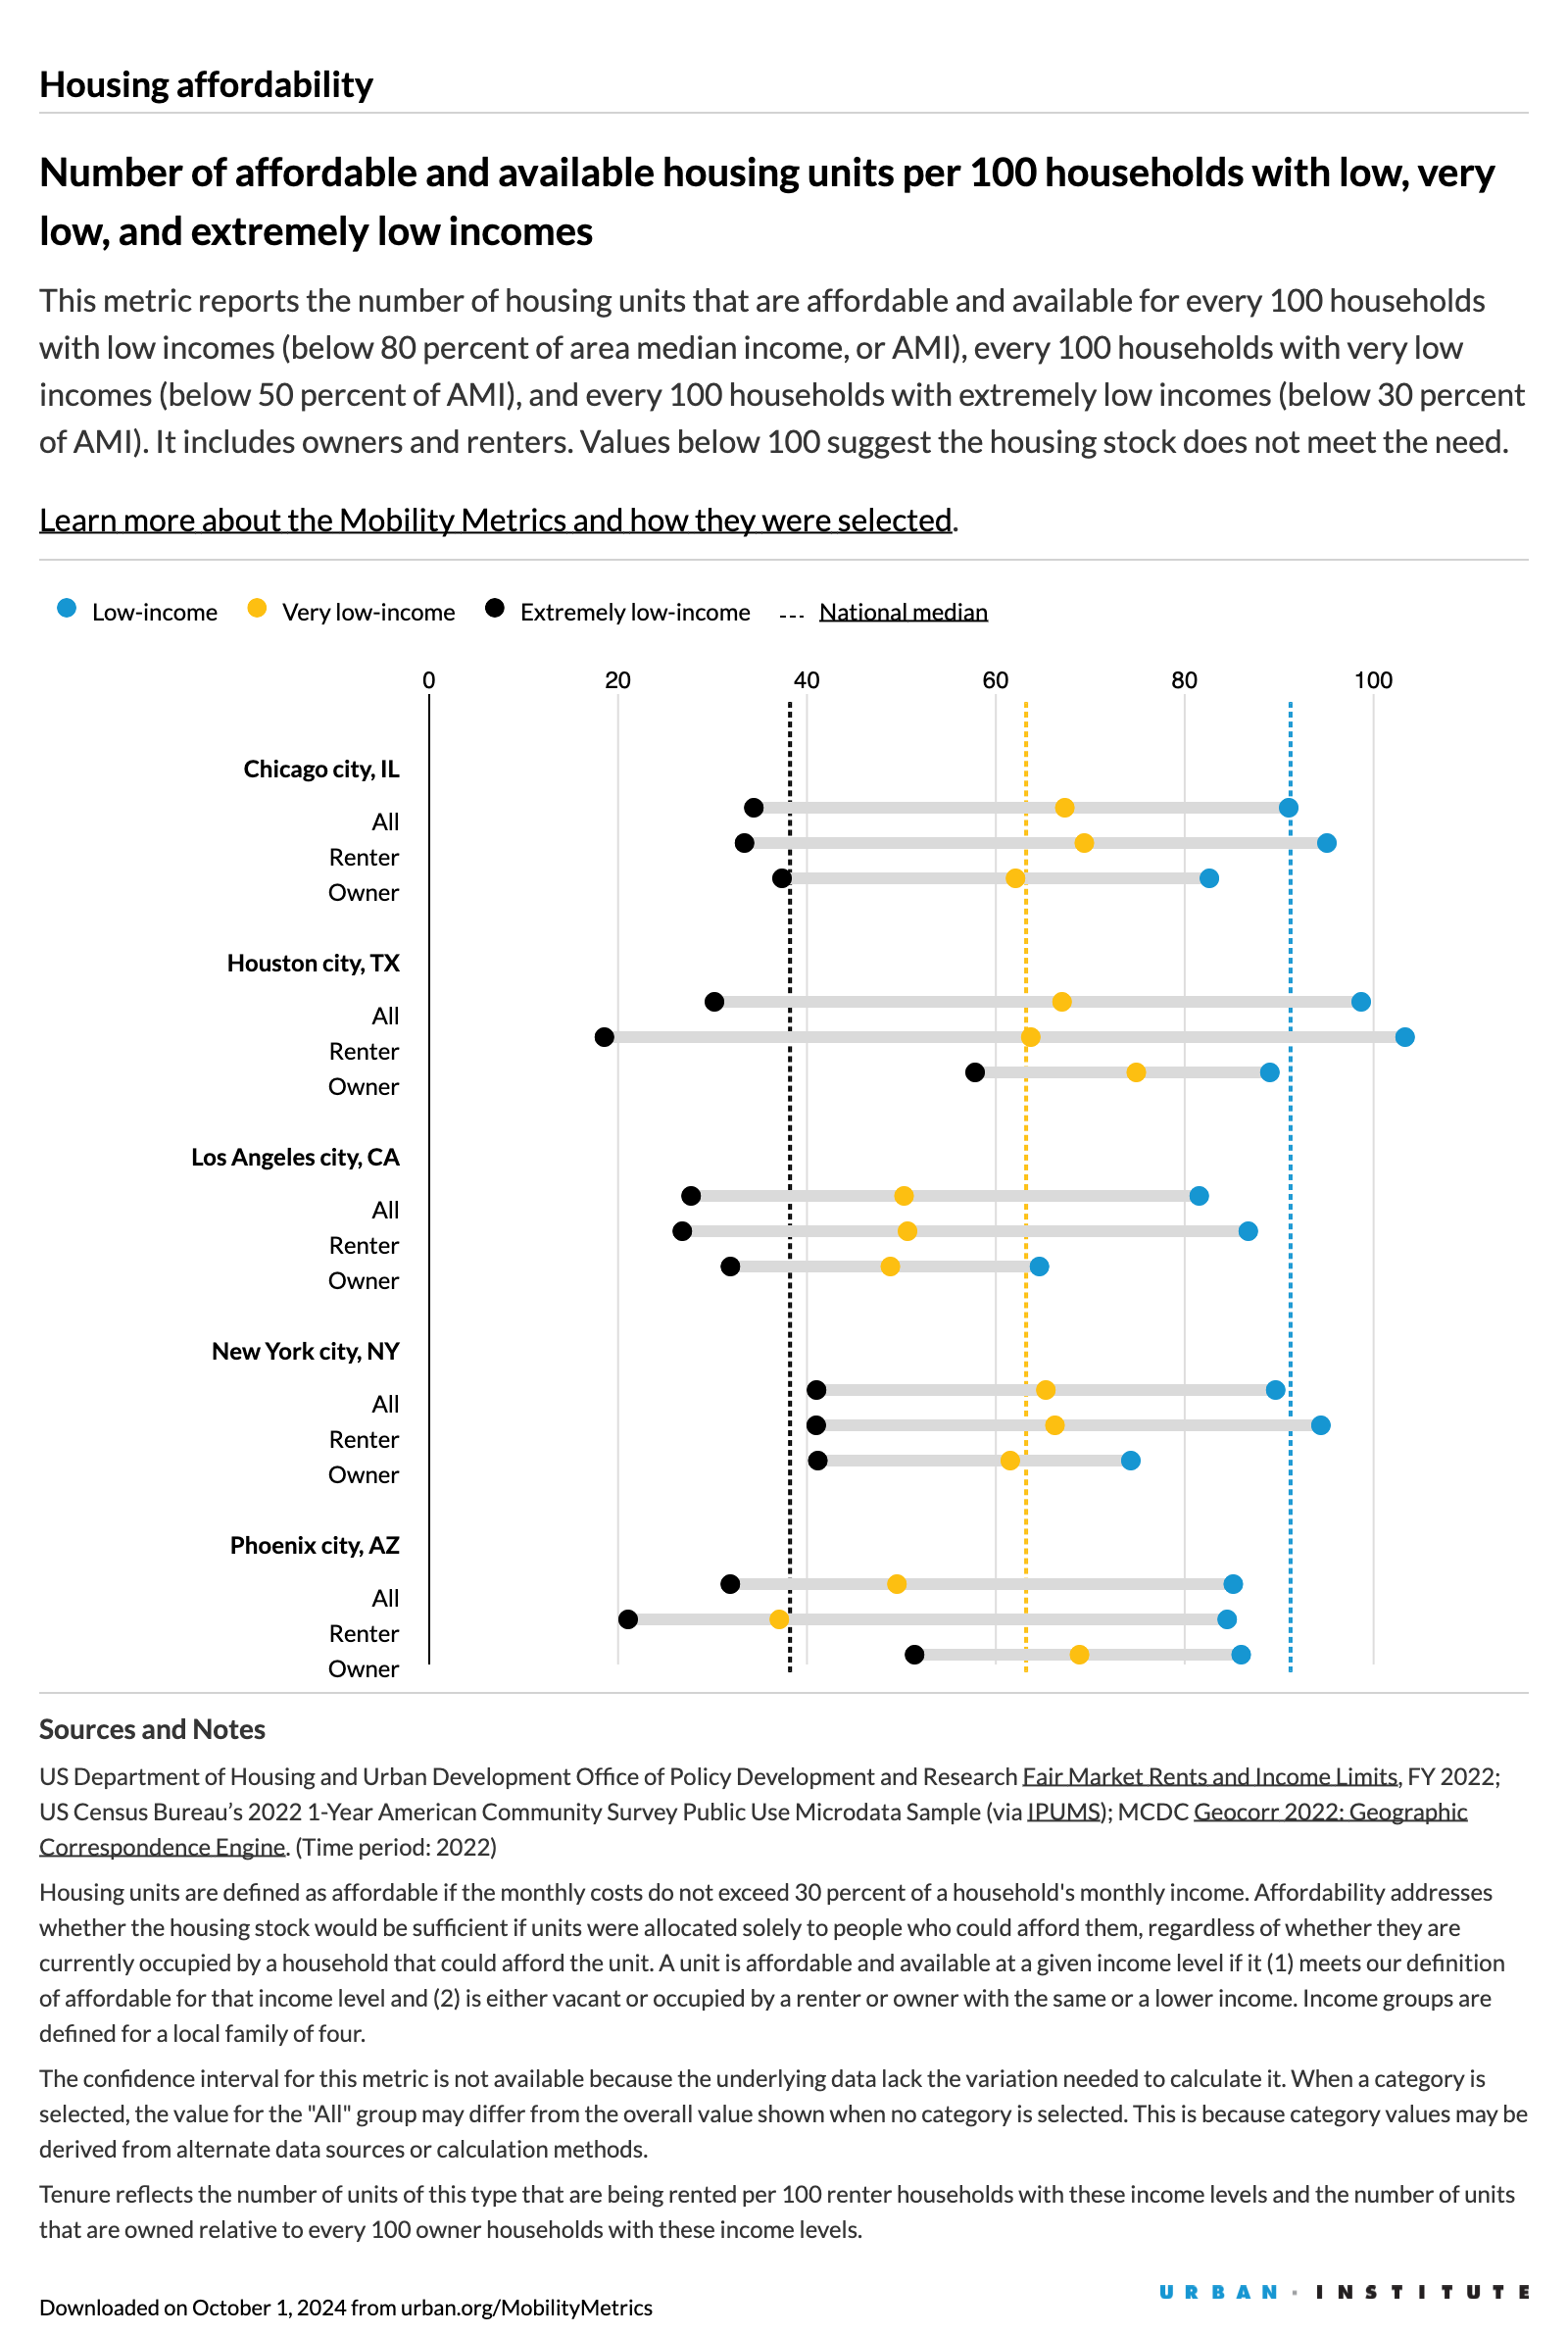
Housing affordability is an issue facing many communities in the US. Access to affordable housing is critical not only for economic success but also for people’s education, health, and sense of belonging. The Mobility Metric for this predictor captures the ratio of housing units available and affordable to households with extremely low, very low, and low incomes. The figure below breaks out these numbers by renter and owner households.
All five cities struggle with providing affordable housing for these income groups, and only Houston has sufficient housing units for renters with low incomes. In Los Angeles, the availability of affordable units is particularly challenging, below the national medians for renter and owner households of all income levels.

VIEW THIS CHART IN THE DASHBOARD
How can local leaders advance upward mobility and racial equity?
Despite these persistent inequities, there are glimmers of hope. Charlotte, North Carolina, and Grand Rapids, Michigan, for example, have seen substantial gains in economic mobility, especially among Black people with low incomes, according to Opportunity Insights.
The Upward Mobility Data Dashboard and similar resources like the Opportunity Atlas can help local leaders striving for similar outcomes by helping them better understand the dynamics and conditions in a community that may inhibit upward mobility. To then identify and act on policy and programmatic solutions, they should consider using the following resources.
- Results for America’s Economic Mobility Catalog includes information on hundreds of evidence-based programs and strategies and dozens of case studies that local leaders can use to increase economic mobility across a range of domains, from early childhood development to financial security.
- Promising local policy interventions are available on the description pages for each predictor in the Upward Mobility Framework. For example, expanding the use of community health workers is one intervention offered for improving the access to health services predictor.
- The Upward Mobility Initiative’s Planning Guide for Local Action helps communities strategize how they will advance systems change to increase upward mobility and racial equity.
Using these tools, local leaders can develop, implement, and monitor policies and programs to ensure all people and communities can reach long-term social and economic prosperity.
Let’s build a future where everyone, everywhere has the opportunity and power to thrive
Urban is more determined than ever to partner with changemakers to unlock opportunities that give people across the country a fair shot at reaching their fullest potential. Invest in Urban to power this type of work.