
<p>GCShutter/Getty Images</p>
With the sudden and widespread take-up of mortgage forbearance (PDF) in response to the COVID-19 pandemic, new data were needed to understand the pandemic’s effects on the US housing market. Several data providers responded to this need, providing timely information on mortgage payments that has helped track how households are dealing with the pandemic. At an Urban Institute webinar, experts from major data providers discussed the new and existing data, sharing what they see in the data and how to most effectively use these resources.
Mortgage data show some borrowers are struggling to get back on their feet
Data providers moved quickly to provide real-time information on forbearance and delinquency. Data from Black Knight, for example, show that after an initial spike, forbearance and delinquency rates declined from March 2020 to January 2021, but some borrowers are having trouble getting back on their feet.
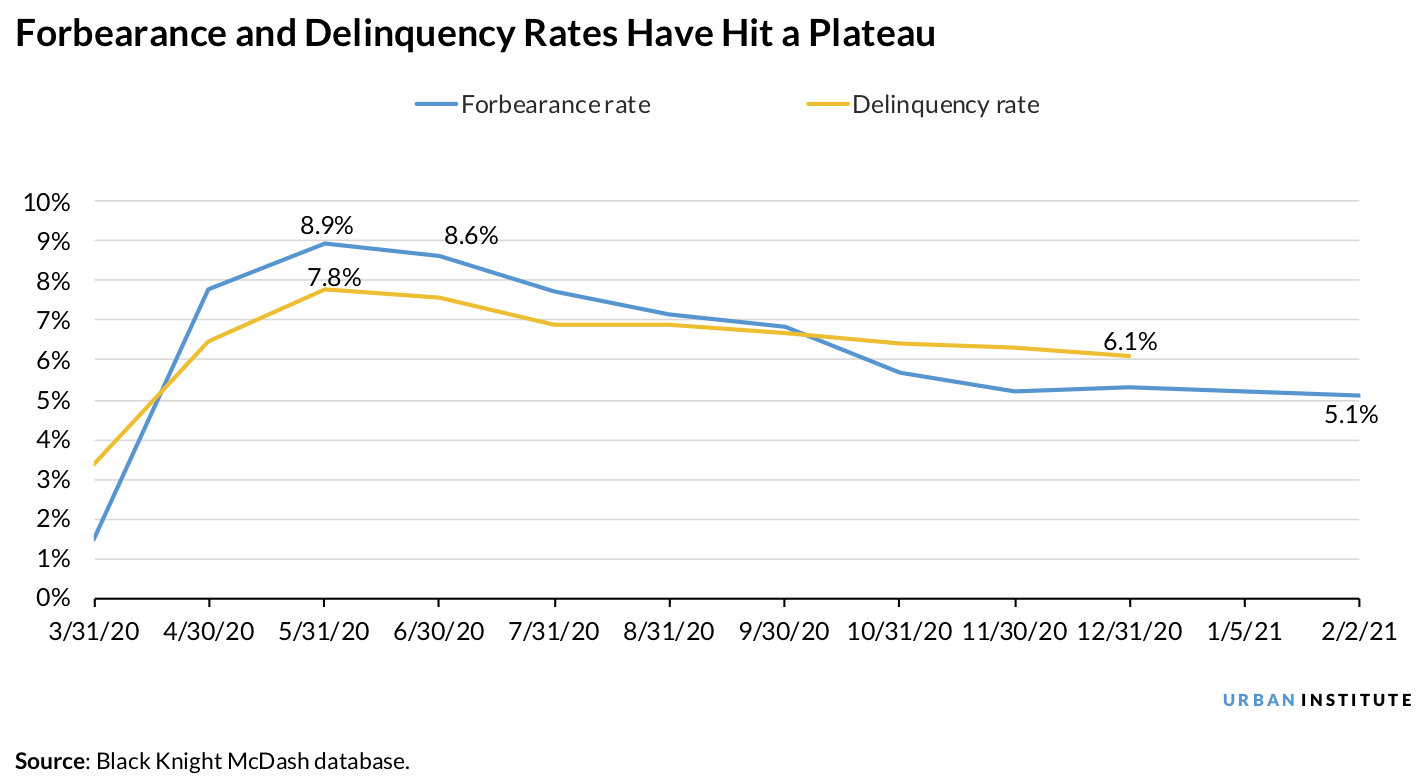
Forbearance rates peaked at 9 percent in late May 2020, before steadily dropping to about 5 percent by the end of January 2021. This decline suggests that households’ overall financial status has improved and that forbearance helped many households at the peak of the crisis.
National delinquency rates also peaked last May at close to 8 percent and declined to about 6 percent by the end of January 2021. This drop can be attributed to the large declines in loans going from current to newly delinquent since the summer. The number of loans that were 30 and 60 days delinquent in December 2020 were both below their prepandemic levels in December 2019. Although the number of early-day delinquencies has been improving, the decline in the overall national delinquency rate has been severely limited by the growing number of serious delinquencies since the pandemic started.
Black Knight data (PDF) show that in December 2020, the number of serious delinquencies, loans that are 90 or more days past due, had far exceeded prepandemic levels at 2.15 million, up 400 percent from December 2019. Together, these data show that although fewer loans are becoming newly delinquent, a subset of borrowers is facing real financial trouble.
How to navigate available datasets on housing payment
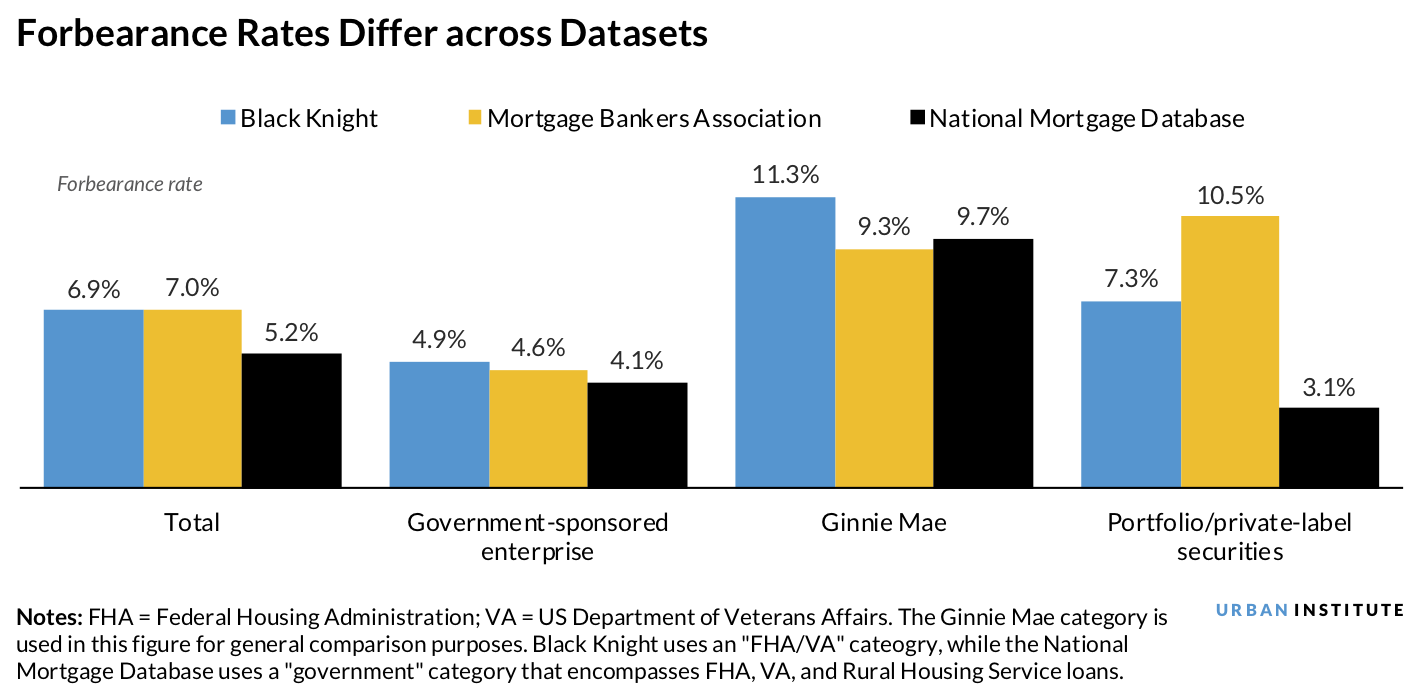
To make the best use of available information on mortgage and rental payments during the pandemic, data users need to understand how datasets differ. Our dataset matrix (PDF) offers links to the most popular datasets and short descriptions to help users find and understand the data they need. The matrix includes “administrative” datasets, which are collected as part of standard operations, and “survey” datasets, which were developed to explore specific questions. Both types can be valuable to policymakers and researchers, but the most useful dataset depends on the research question being asked. There are significant disparities across datasets based on what data are collected, how they are collected, and how they are organized.
For example, Black Knight’s data showed a higher forbearance rate in Ginnie Mae loans in September than the Mortgage Bankers Association’s (MBA’s) data. This discrepancy occurred because Black Knight counted Ginnie Mae loans that had been bought out of securities in its forbearance reporting while the MBA categorized those buyouts in its portfolio bucket. As such, the MBA’s Ginnie Mae forbearance rates were lower, but its private loan forbearance rates were higher. For data users, these differences show the importance of comparing and understanding the methodologies of different datasets.
Although additional housing payment data have helped during the pandemic, no data are perfect. Black Knight and the MBA’s administrative datasets provide comprehensive data on forbearance and delinquencies but do not include demographic and socioeconomic information. And survey datasets, including the Census Bureau’s Housing Pulse Survey and the University of Southern California’s Understanding America Study, provide detailed information on households and individuals but have smaller sample sizes and greater statistical errors.
The limitations of survey data are particularly apparent in the rental market space, which lacks real-time data and has fewer data in general. The data that are available tend to show a higher share of renters missing rental payments than the administrative data show, suggesting that the survey results need to be interpreted with caution. Avail, a platform that helps do-it-yourself, mom-and-pop landlords manage their units, has recently provided both survey and administrative data on renters, which showed that the subset of their renters who participated in the survey was more likely to report that they have missed their rental payment compared with total renters on the Avail platform.
Policymakers can use available datasets to better support people most affected by the pandemic
As the pandemic continues to disrupt people’s lives and livelihoods, policymakers and practitioners need to monitor those who come out of forbearance after the forbearance period ends and renters who cannot make payments. Homeowners who remain in forbearance longer are likely to be financially worse off than those who exited earlier, so they will need more support to resume their mortgage payments. But safety measures such as the loss mitigation waterfall and the home equity buffer are expected to protect even the riskier homeowners in forbearance from foreclosure.
In the rental space, we need more data to accurately measure those who are behind on rental payments and how much support is needed. The estimates of total back rents owed by renters differ significantly by institution, which is causing confusion for renters. For example, Moody’s estimates back rents total $57.3 billion (PDF), while the Philadelphia Federal Reserve estimates the total is $7.2 billion. It is unclear whether the Biden administration’s $25 billion of additional rental assistance is significant for renters, who have been hit harder by the pandemic than homeowners.
By understanding new and existing housing market data, policymakers can support homeowners, renters, and landlords throughout the pandemic.
Let’s help communities build more secure, hopeful futures.
Today’s complex challenges demand smarter solutions. Urban brings decades of expertise to understanding the forces shaping people’s lives and the systems that support them. With rigorous analysis and hands-on guidance, we help leaders across the country design, test, and scale solutions that build pathways for greater opportunity.
Your support makes this possible.