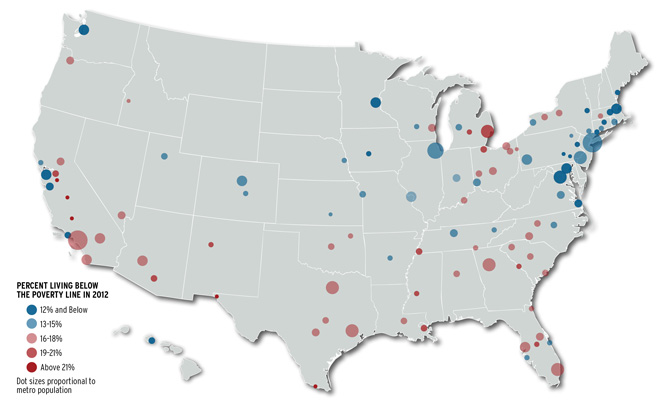
Across the top 100 metros, poverty rates in 2011 varied substantially, as shown in the map. Metro areas around Washington, DC, and Stamford, Connecticut, had the lowest poverty rates, and many New England and West North Central metros also had low poverty rates.
McAllen, Texas, experienced the highest poverty rate (38 percent) of any big metro area. Metro areas around Fresno, Bakersfield, and Modesto, California, and El Paso, Texas had poverty rates of about 25 percent, putting them among the worst. Metro areas with the highest poverty tended to be in medium-sized metro areas in the South and East North Central divisions, though larger metros in the West region also stand out on the map.
Most metro areas have rates closer to the national average, near 15 percent. The metro-area poverty rates are based on data from the American Community Survey (ACS), which shows a national poverty rate of 15.9 percent. The official national poverty rate, however, is based on the Current Population Survey (CPS), which shows a 15 percent poverty rate. For more about the official poverty statistics, read the latest Urban Institute Poverty Brief. For the difference between the ACS and CPS poverty numbers, see the latest Poverty Factsheet.
Percent of Individuals Living Below the Federal Poverty Line In the Top 100 Metros
Let’s help communities build more secure, hopeful futures.
Today’s complex challenges demand smarter solutions. Urban brings decades of expertise to understanding the forces shaping people’s lives and the systems that support them. With rigorous analysis and hands-on guidance, we help leaders across the country design, test, and scale solutions that build pathways for greater opportunity.
Your support makes this possible.