Public transit and equitable access to employment are intrinsically linked. Lower-paid workers tend to have higher unemployment rates and longer spells of joblessness in areas with less connectivity between jobs and homes. And in many cities, transit riders are predominantly people of color, who are less likely to have access to cars and—when using transit—often face unreliable service, unequal access, and high costs. In Washington, DC, for instance, an estimated 81 percent (PDF) of bus riders are people of color and 46 percent have low incomes.
The $1.2 trillion federal Infrastructure Investment and Jobs Act (IIJA) passed in 2021 offers localities an opportunity to fund transformative transit investments. But to receive competitive funding, IIJA requires applicants to make data-driven cases about how proposed projects benefit low-income communities and communities of color. Many local applicants face challenges to conducting such analyses, highlighting the need for easy-to-use tools that help public agencies model a project’s equity impacts.
Responding to this need, our team developed a new approach to estimate equity impacts of transit investments. We partnered with the Washington Metropolitan Area Transit Authority (Metro) to assess current and proposed bus priority lanes, which allow buses to bypass traffic congestion. However, priority lanes are often blocked by other vehicles, which has led to debate about keeping lanes clear while avoiding equity blind spots.
Greater enforcement is associated with more effective bus priority lanes
In our models, we used Metro data to show how the proposed priority lane investments would affect the number of jobs accessible to DC residents within 30 minutes by transit. We compared the effectiveness of priority lanes at three different performance levels (clear lanes 50, 75, and 100 percent of the time) to another approach that would increase existing bus line frequency on the same streets by approximately 35 percent without implementing priority lanes (for more information, see our Data@Urban blog post).
Our model shows that, for the average DC resident, more-frequent buses could expand the number of jobs accessible within 30 minutes by almost 30,000—equivalent to a roughly 60 percent increase—largely because of shorter waiting times. Well-enforced and unobstructed priority bus lanes, however, could expand access even more, increasing job accessibility by more than 40,000 jobs for the average resident—equivalent to a roughly 90 percent increase. That’s based on our projection that these lanes could speed up service, getting people to more places faster.
Ensuring that priority bus lanes remain clear of cars and other blockages is crucial. If bus lanes are clear only 75 percent of the time—meaning buses cannot travel faster than traffic for 25 percent of their route—their benefit in terms of average job accessibility would decline by more than half. The benefits decline even further if lanes are clear only half of the time.
Less Enforcement of Priority Bus Lanes Decreases Their Effectiveness

When we modeled changes in accessibility from central Anacostia in Southeast DC, for example, we found that bus lanes with only 50 percent enforcement would fail to ensure reliable commuter access to downtown within 30 minutes. However, 100 percent enforcement would make the trip a reliable one for daily commuters.
Job access gains vary by ward
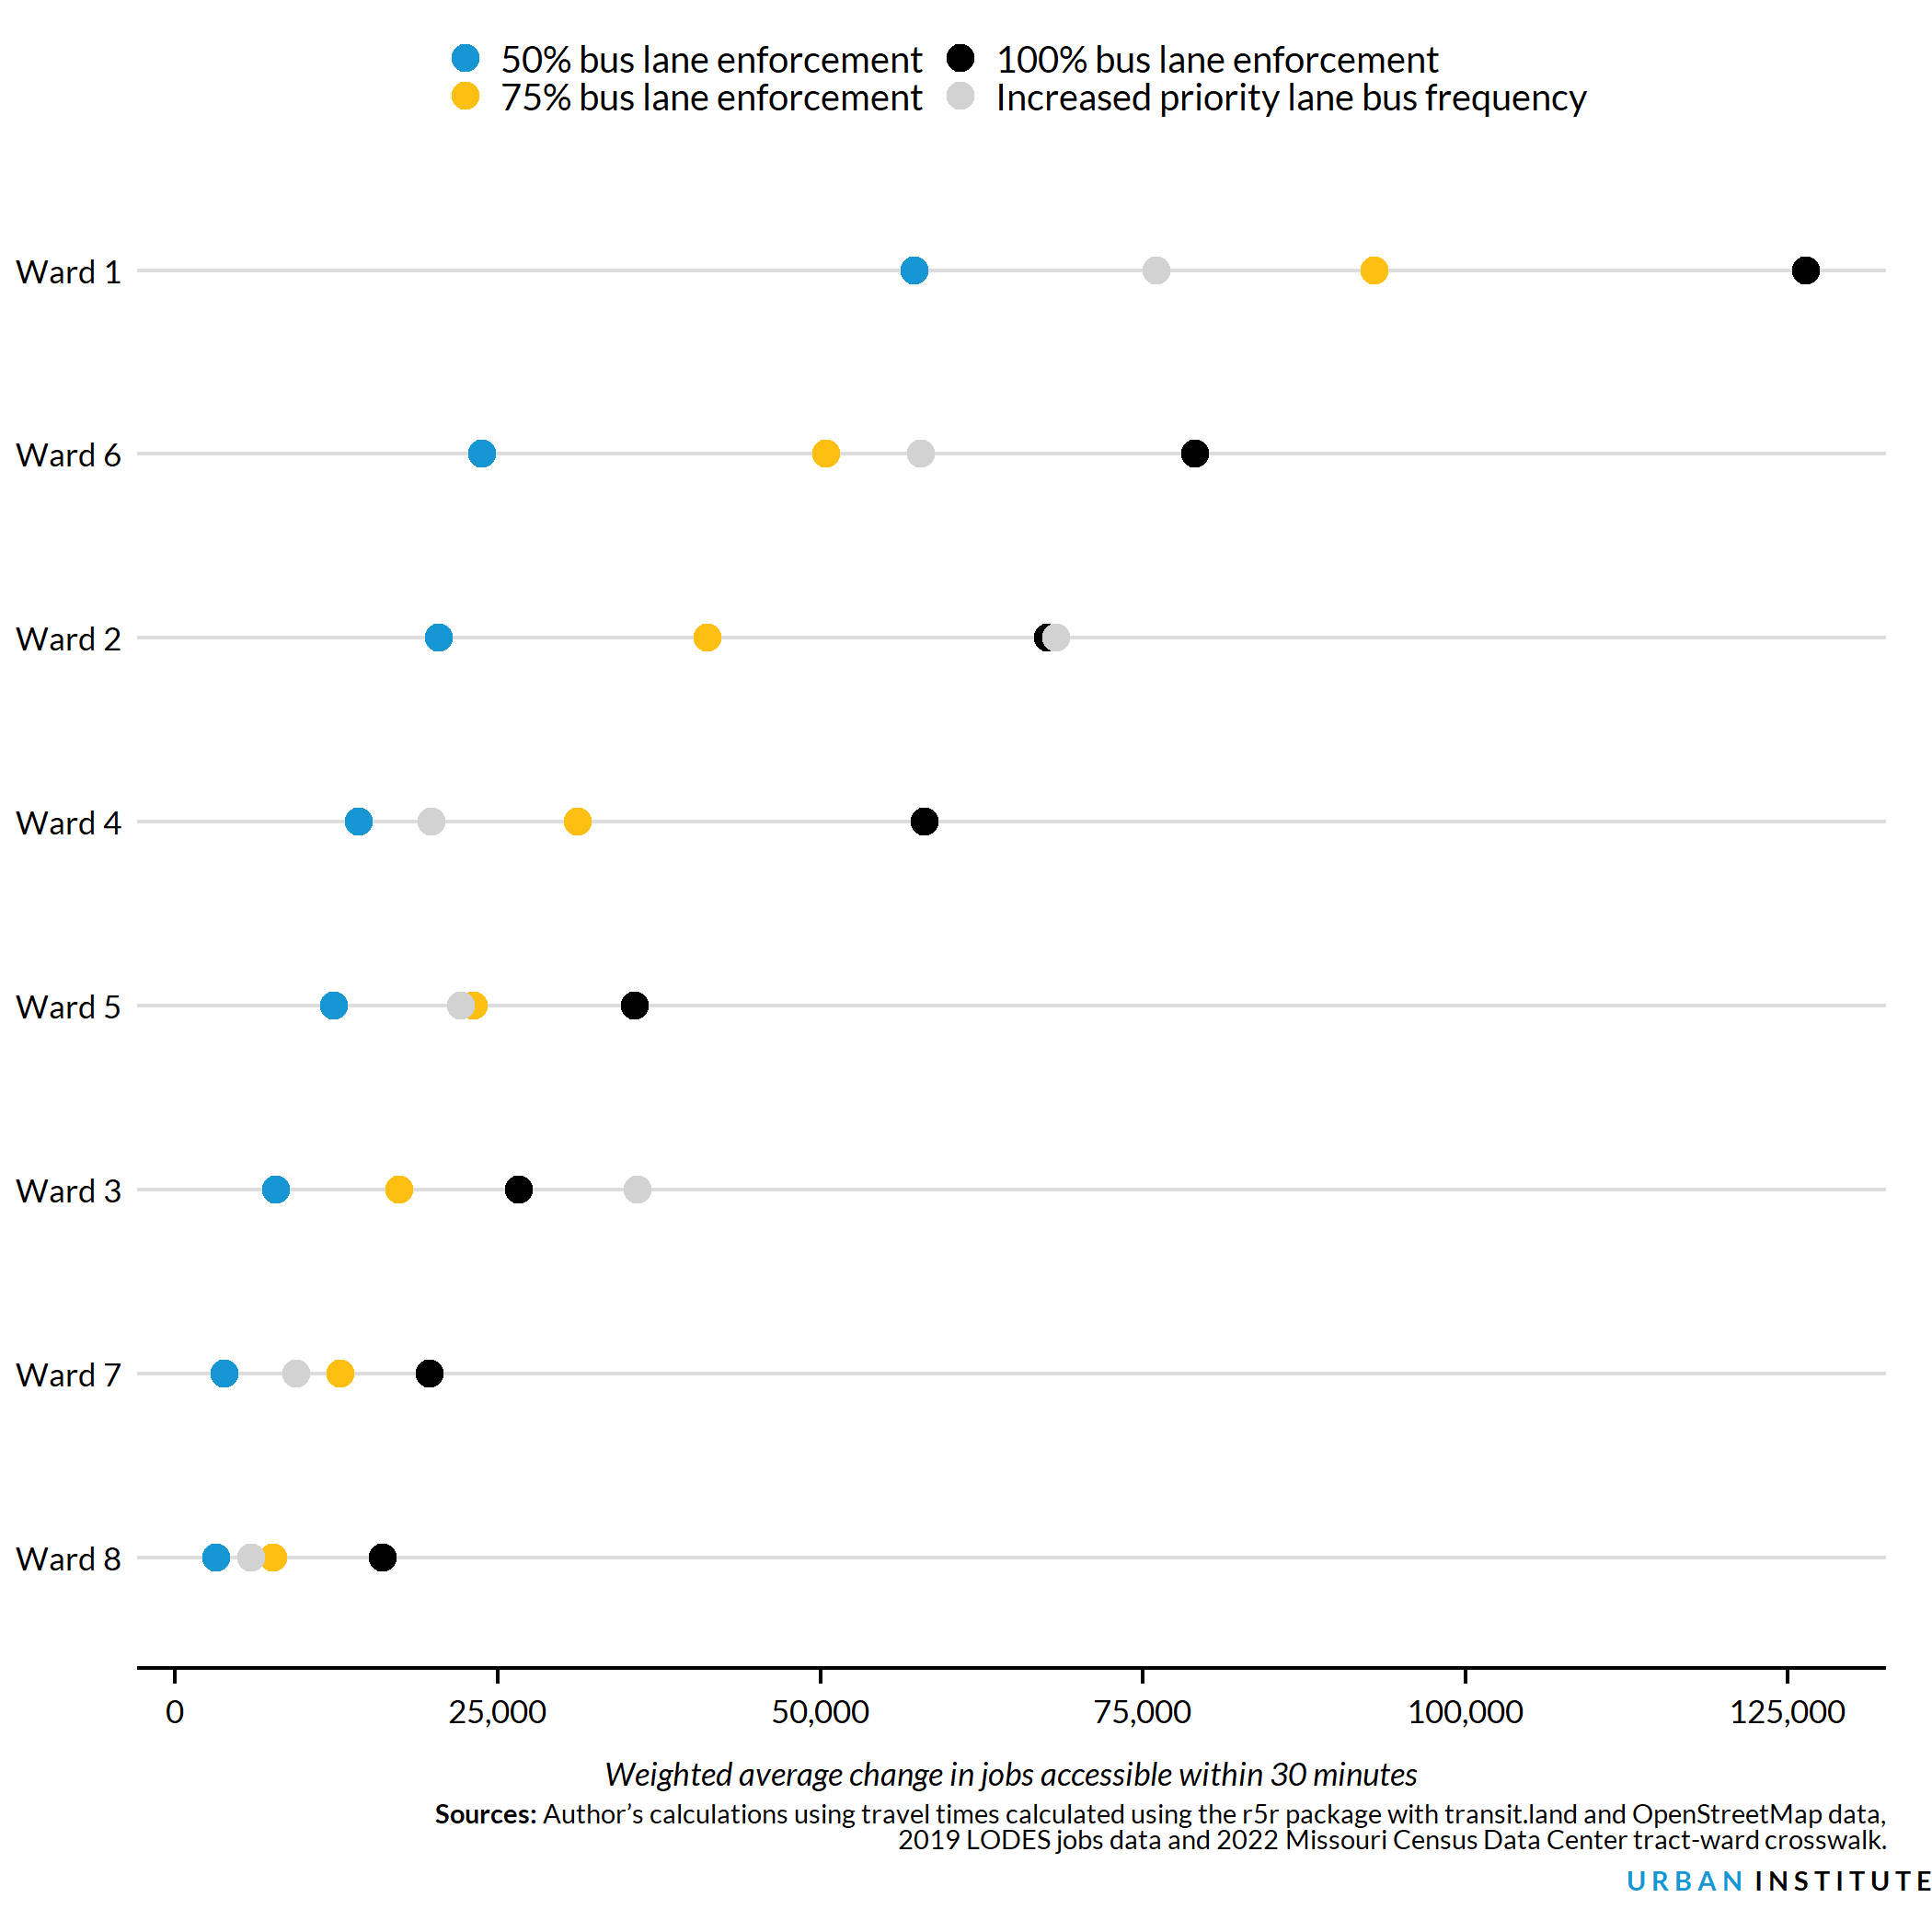
Although each scenario positively affects all of DC’s eight wards, we find that Wards 7 and 8, in which half of DC’s Black residents live, experience the smallest gains.
DC’s Wards with More Black Residents Experience the Smallest Job Access Gains

We must recognize, however, that the potential beneficiaries of transit improvements based on neighborhood demographics may not reflect the riders who benefit. According to surveys conducted by Metro (PDF), bus riders are disproportionately people of color—representing 81 percent of riders compared with 60 percent of residents in Metro’s service area. These surveys highlight that people often ride transit in areas outside their home neighborhoods. For example, the 31 and 33 bus routes, which run in neighborhoods whose residents are more than 70 percent white, have bus riders who are 50 percent people of color (PDF).
Overall, these results indicate that the significant improvements in bus service enabled by well-enforced priority lanes could expand job accessibility for people of color, who make up the majority of bus riders. However, to ensure bus priority lanes close racial equity gaps for DC’s Black residents, Metro should also increase investments in Wards 7 and 8.
Well-enforced bus priority lanes could enable greater access gains at lower costs
Both higher frequencies and bus priority lanes could improve access to employment, but they also have financial implications. Higher bus frequencies would increase operating costs in terms of daily trips and miles driven, whereas priority bus lanes would reduce the number of hours buses operate along routes even though the number of miles buses operate would remain the same.
Using agency-provided data about service costs per mile, we provide coarse estimates of how these changes affect operation costs. In these estimates, we hold changes in bus travel speeds as directly proportional to changes in operating costs, based on previous research. We do not account for many related issues, such as the cost to establish bus priority lanes, climate impacts of additional vehicle miles, training costs for new drivers, costs for additional buses, maintenance costs, and enforcement costs.
Approximate Total Change in Weekday Bus Operation Costs by Scenario
| Scenario | Daily trips change | Daily service hours charge | Daily service hours charge | Approximate daily impact on agency operating budget, based on estimated $204 in operating expenses per hour |
| 50% bus lane enforcement | 0 | 0 | ~–415 | ~–$98,000 |
| 75% bus lane enforcement | 0 | 0 | ~–620 | ~–$145,000 |
| 100% bus lane enforcement | 0 | 0 | ~–825 | ~–$194,000 |
| Increase priority lane bus frequency | ~8,000 | ~52,500 | ~5500 | ~+$1.2 million |
Source: Authors’ calculations based on general transit feed specification (GTFS) data reported by the Washington Metropolitan Area Transit Authority to transit.land and edited using the gtfstools package and the 2021 National Transit Database.
Notes: Data presented are sketch-level models and require detailed analysis to be confirmed. Impact on agency operating budget is based on the Washington Metropolitan Area Transit Authority’s 2021 reports to the National Transit Database, which show $704 million in bus operating expenses across 3.5 million vehicle revenue hours, thus an average of about $204 in operating expenses per hour.
Together, our results suggest that well-enforced bus priority lanes could enable greater access gains at lower costs than frequency increases, but more research is needed to assess the financial and quality of service trade-offs between those options. To achieve just outcomes in DC, local policymakers must consider how to enact these changes in a way that supports expanding racial equity.
Ultimately, additional investment is needed to close access gaps, such as adding transit in Wards 7 and 8, creating jobs in Black communities, and developing affordable housing citywide. Investments should also target other barriers to equitable employment, such as skills mismatch and discriminatory hiring.
We hope to build on this pilot to create a nationwide tool that will enable transit agency staff and community members to model the equity impacts of transit investments in their own communities.
Let’s build a future where everyone, everywhere has the opportunity and power to thrive
Urban is more determined than ever to partner with changemakers to unlock opportunities that give people across the country a fair shot at reaching their fullest potential. Invest in Urban to power this type of work.