<p>A woman walks down a street in Philadelphia, Thursday, May 4, 2017. Photo by Matt Rourke/AP.</p>
Sports are often cited as a unifying force in society, with the power to bring strangers together to cheer for their hometown team (or help each other climb greased-up light poles).
But how well do the two Super Bowl cities—Boston (New England Patriots) and Philadelphia (Philadelphia Eagles)—perform on a playing field that includes measures of inclusion and opportunity? Below are breakdowns of the two cities’ performance on the “urban sabermetrics” of financial health, economic and racial segregation, rental housing affordability, and strength of civil society.
Financial health
Financial health measures how well residents can manage daily finances, respond to unexpected economic shocks, and pursue opportunities to move ahead.
For example, delinquent debt shows that people struggle to pay their bills. One reason is that housing costs consume an increasing amount of income.
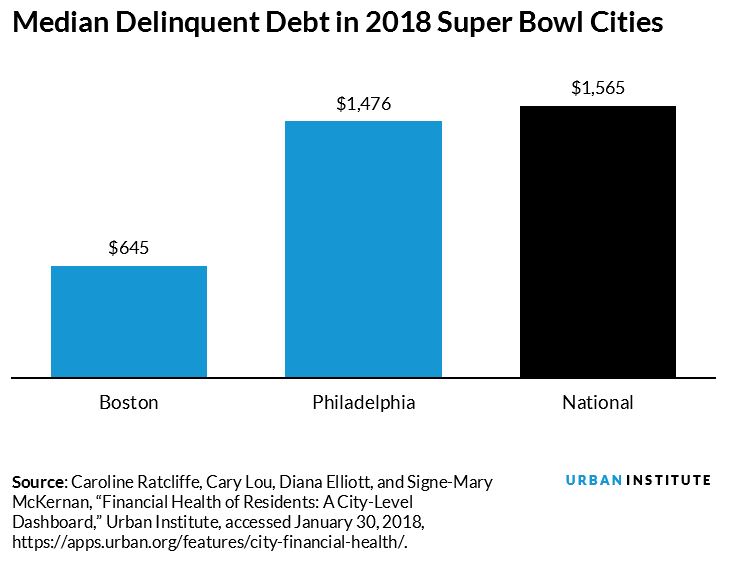
In Boston and Philadelphia, roughly 75 percent of low-income residents spend more than 30 percent of their income on housing. This high housing-cost burden affects their ability to build savings that can help them be more resilient when they face unexpected, negative economic events.
Families with savings cushions of a few hundred dollars are less likely to be evicted, miss housing or utility payments, or receive public benefits after a job loss or drop in income. Delinquent debt and foreclosures also affect residents’ credit scores and ability to borrow, which makes these residents more susceptible to unexpected financial shocks or be unable to qualify for home loans.

Economic and racial segregation
The consequences of segregation include a lack of access to education and other services, fewer job prospects, and poor health outcomes. Less segregated regions have higher black incomes, higher bachelor's degree attainment for blacks and whites, and lower homicide rates, all of which increase economic vibrancy.
An Urban Institute and Metropolitan Planning Council study in the Chicago region found that segregation cost the region $4.4 billion in additional income each year. The Chicago and Philadelphia regions have similar levels of black-white and Latino-white segregation, but the Philadelphia region is more economically segregated. The Chicago and Boston regions have similar levels of Latino-white segregation, but the Boston region has less economic and black-white segregation.
It is difficult to infer the cost of segregation to each region without further study, but based on what we know about its effects in the Chicago region, the cost of segregation in the Philadelphia and Boston regions is likely high.

Affordable rental housing
There is not enough affordable housing to meet the needs of extremely low–income (ELI) households (households of four with annual income between $21,250 and $33,850, depending on location). Nationwide, there are only 46 adequate, available, and affordable rental units for every 100 ELI renters, and over half of those units are made affordable by federal rental assistance programs.
The number of ELI households has increased because of economic hardship and a lack of wage growth, and the supply of rental housing has not kept up with demand. As a result, there is growing pressure at lower price points, which forces families to make tough decisions about other important household costs, such as health care and investments in children’s education.
In 2014, Philadelphia County had 41 affordable units per 100 ELI households, while Suffolk County, where Boston is located, had 61 units per 100 ELI households. Despite having fewer ELI rental households, Suffolk County has nearly the same number of affordable units as Philadelphia County.
Suffolk County and other Boston-area counties have some of the smallest gaps in units affordable to ELI renters. Despite Boston being a high-cost metropolitan area, concerted efforts by state and local government have helped develop and preserve affordable units.
Civil society
The nonprofit sector employs 10 percent of all US employees and makes up 5 percent of our gross domestic product. It also plays an increasingly important role in communities by filling gaps in the social safety net and providing services for low-income residents. Analysis of National Center for Charitable Statistics data from 2015 shows the magnitude of the nonprofit sectors in Boston and Philadelphia.
In 2015, public charities in the Philadelphia metropolitan area had revenue of $63.1 billion and assets of $132.5 billion, compared with revenue of $99.7 billion and assets of $281.3 billion in the Boston metropolitan area. The Philadelphia area has 16.5 public charities per 10,000 residents, and the Boston area has 28.0 public charities per 10,000 residents.
Unlike Sunday’s game, there won’t be a clear victor. But the data tell us that these metropolitan areas, much like their football teams, have strengths to leverage and weaknesses to address to win the biggest game in town.
Let’s help communities build more secure, hopeful futures.
Today’s complex challenges demand smarter solutions. Urban brings decades of expertise to understanding the forces shaping people’s lives and the systems that support them. With rigorous analysis and hands-on guidance, we help leaders across the country design, test, and scale solutions that build pathways for greater opportunity.
Your support makes this possible.