
<p>(SolStock / Getty Images)</p>
Today, more than 36 million families will receive their first advance child tax credit payments. This marks a historic new investment in the nation’s children, and the Biden administration has signaled it will continue to prioritize lifting families out of poverty.
Now, state and local governments must determine how to spend other new federal funding from the American Rescue Plan Act in ways that complement existing investments. An accurate picture of current public spending can help them make the best use of new public funds, helps the federal government ensure its new investments do not exacerbate existing spending differences across states, and enables a better understanding of the effects of public spending on the families and children who rely on it.
Our State-by-State Spending on Kids Dataset offers the most comprehensive account of public spending on children available, and it gives state and federal administrators the data they need to make informed decisions amid pandemic relief.
Public spending on children varies across states
The Urban Institute’s Kids’ Share series has tracked public spending on children for more than two decades, but our State-by-State Spending on Kids Dataset is the first to track spending in each state. The dataset combines and analyzes information from the US Census Bureau’s Annual Survey of State and Local Government Finances with data from a small number of direct federal funding streams, such as Medicaid, the earned income tax credit, and Head Start. Together, they allow us to track federal, state, and local public spending on children from 1998 through 2016.
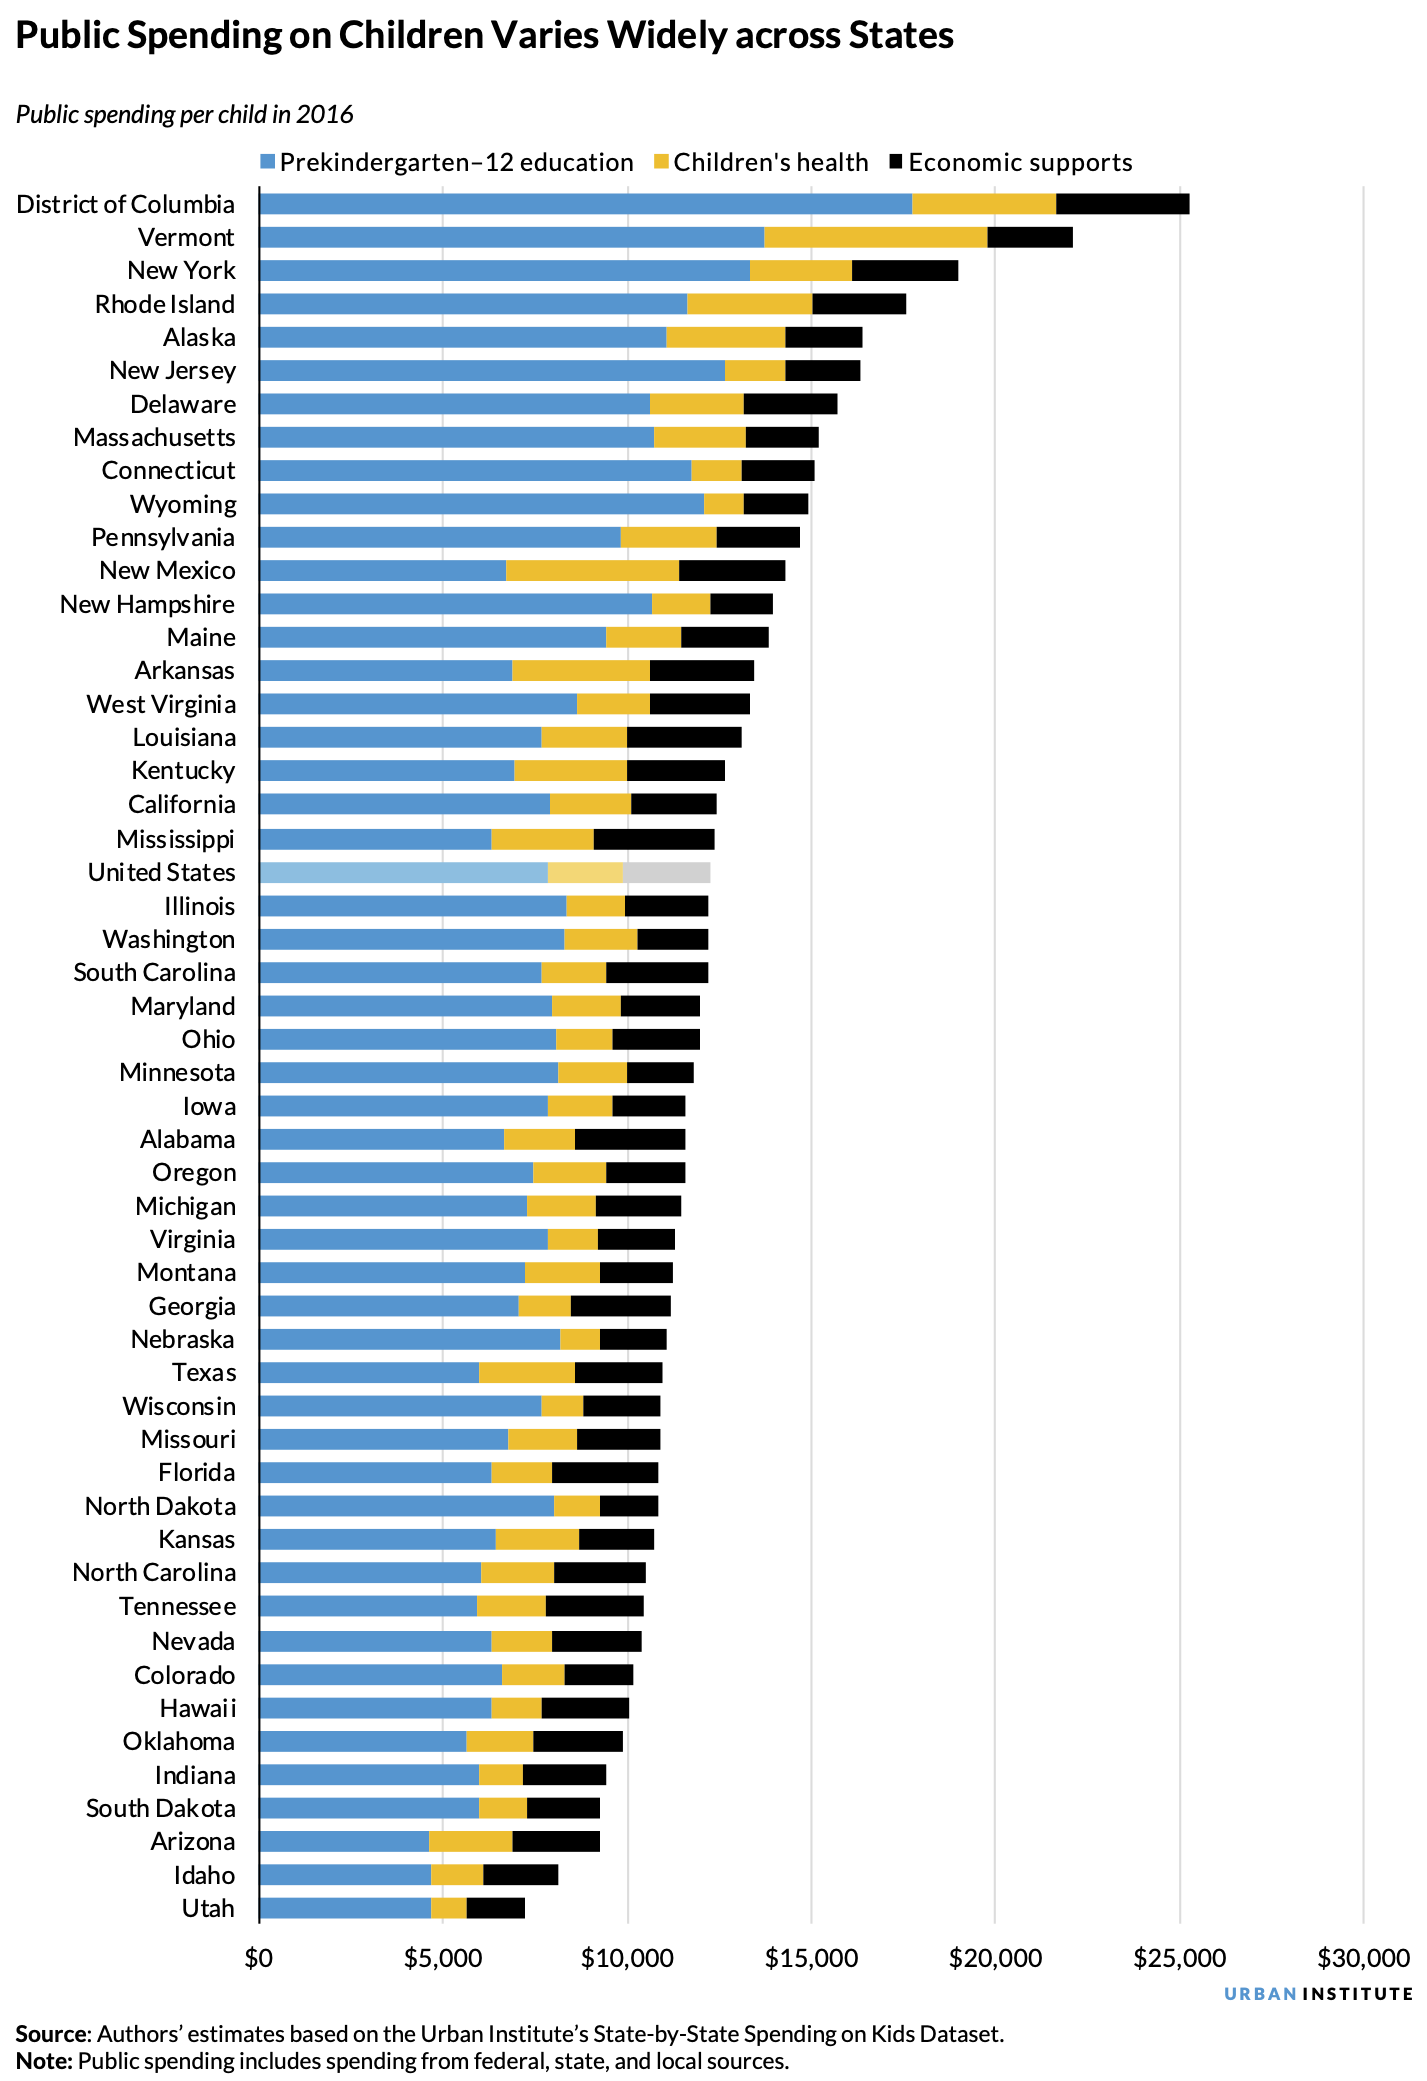
We analyzed public spending on children in 2016, the most recent year of data available, and the results suggest wide variation in public spending across states. The District of Columbia and Vermont, which had the highest spending per child ($25,244 and $22,091, respectively), spent three times more than Utah and Idaho, which had the lowest ($7,220 and $8,096).
We grouped spending into prekindergarten–12 education, children’s health, and economic supports (including earned income and child tax credits, Supplemental Nutrition Assistance Program benefits, and cash payments through the Social Security, Supplemental Security Income, and Temporary Assistance for Needy Families programs). Other than DC and Vermont, New York had the highest per child spending on education ($13,334), New Mexico had the highest per child spending on health ($4,706), and Mississippi had the highest per child spending on economic supports ($3,231). States that spend more on one type of spending do not always spend more on another type (the correlations between the three types of spending range from 0.13 to 0.46).
Why does public spending vary?
Sometimes, increased spending reflects greater need among children in the state. For example, states with depressed economies and larger shares of children living in households with low incomes qualify for more funding from federal programs intended to assist families with meeting basic needs.
Spending on children also varies because the cost of providing services differs across states. This analysis does not adjust for differences in cost of living, but an earlier analysis of state spending on children found such adjustments lowered the gap between highest and lowest but generally did not change the ranking across states.
Other times, increased spending reflects policy choices. States and localities make decisions including how much to pay teachers, whether to expand Medicaid, and whether to provide a state earned income tax credit. These choices may reflect political decisions but are also influenced by the economic base from which a state can raise revenues to support spending. States range in their ability to distribute the supplemental or matching funds required in some new federal laws and proposals, and the COVID-19 crisis has affected state budgets differently.
State differences in spending affect children’s abilities to thrive
The State-by-State Spending on Kids Dataset illustrates where and how new federal investments can best support children and families. Take New Jersey as a case study: we found state investments in public education drive per child spending in New Jersey higher than in many other states, but New Jersey spends less on health and economic supports, and draws down less in federal spending across all categories, than the US average. This pattern of investments may explain why New Jersey ranks high (PDF) on educational outcomes, but large socioeconomic, racial, and ethnic disparities remain.
Public investments matter for families’ ability to support children’s healthy development. As the American Rescue Plan Act funding rolls out, advance child tax credit payments hit families’ bank accounts, and Congress considers additional proposals, now is the time for data and evidence to drive smarter public spending. Our dataset can inform policies meant to address long-standing budget constraints and policies to advance equity across states so all American children have an equal opportunity to thrive.
The Urban Institute has the evidence to show what it will take to create a society where everyone has a fair shot at achieving their vision of success.
Let’s help communities build more secure, hopeful futures.
Today’s complex challenges demand smarter solutions. Urban brings decades of expertise to understanding the forces shaping people’s lives and the systems that support them. With rigorous analysis and hands-on guidance, we help leaders across the country design, test, and scale solutions that build pathways for greater opportunity.
Your support makes this possible.