
September is Hunger Action Month and, coincidentally, Congress will likely debate proposed legislation that would cut SNAP (formerly food stamps) by $40 billion over the next 10 years. This proposal has been sparked partly by the jump in SNAP participation since the onset of the Great Recession.
Never mind that that jump means the program is working exactly as intended and SNAP participation will likely decline significantly in coming years. With the annual poverty numbers coming Tuesday, it’s interesting to examine the relationship between SNAP benefits and poverty.
Technically, the government doesn’t count the monetary value of SNAP benefits when it calculates poverty rates. Call the share of people whose monthly income is under the SIPP poverty line the “official” monthly poverty rate. Then imagine an “unofficial” monthly poverty rate where a household’s income includes SNAP benefits. The chart below plots both of those numbers for each month since 2004.
The upshot is that the difference between these “official” and “unofficial” poverty rates is about a percentage point each month before 2008 and about two points after 2009 - and those two percentage points represent millions of people. In other words, in the last few years SNAP has played a bigger role in reducing economic hardship.
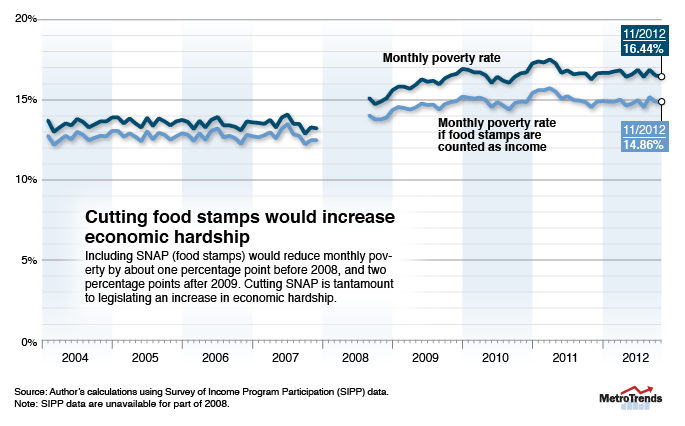
Cutting SNAP is therefore tantamount to legislating an increase in economic hardship—a fact Congress ought to keep in mind this month. Graphic by Tim Meko, Urban Institute
Photo by Tamir Kalifa/AP
Let’s help communities build more secure, hopeful futures.
Today’s complex challenges demand smarter solutions. Urban brings decades of expertise to understanding the forces shaping people’s lives and the systems that support them. With rigorous analysis and hands-on guidance, we help leaders across the country design, test, and scale solutions that build pathways for greater opportunity.
Your support makes this possible.