In many cities, low-income residents live far from available jobs, and employers can’t find people to fill open positions. Economists call this “spatial mismatch”—a mismatch between where jobs are located and where job seekers live, which can cause high unemployment rates and lead to longer spells of joblessness.
Data from Snag, the largest online marketplace for hourly jobs, show us that this is true for job seekers who use their platform. Snag data capture a large number of low-wage job seekers in each metropolitan statistical area (MSA). Across all the MSAs in our sample, Snag data represent 13 percent of all new hires in 2017, as measured by the Quarterly Workforce Indicators, a longitudinal dataset of economic indicators from the US Census Bureau.
Snag data give us a unique view of the labor force because they reflect hourly, often minimum-wage jobs, which can’t always be found in traditional jobs data. The jobs are predominantly full time, and most are restaurant, retail, and customer service positions. The applicants in the system generally have only a high school diploma and are evenly split by gender. Unlike traditional job datasets, these data include all job postings and all applicants (rather than only matched jobs) and are available at the zip code level.
Looking at 2017, the most recent year of data, we analyzed the distance between every job seeker and the jobs they applied for, allowing us to map out spatial mismatch. And we talked to local government and workforce officials in two regions to learn what they’re doing to overcome this problem.
What spatial mismatch looks like in San Francisco and in Columbus
To map out spatial mismatch, we looked at the San Francisco Bay Area in California and the Columbus region in Ohio.
In 2017, most zip codes in the Bay Area had an overabundance of Snag jobs and an undersupply of Snag job seekers within a reasonable radius of those jobs, perhaps because high housing costs keep low-wage earners from living in the city. The map below shows that San Francisco Bay Area employers who use Snag do not have enough job seekers who live within a reasonable distance of their jobs in most neighborhoods (represented in pink).
Spatial Mismatch in the San Francisco Bay Area, 2017
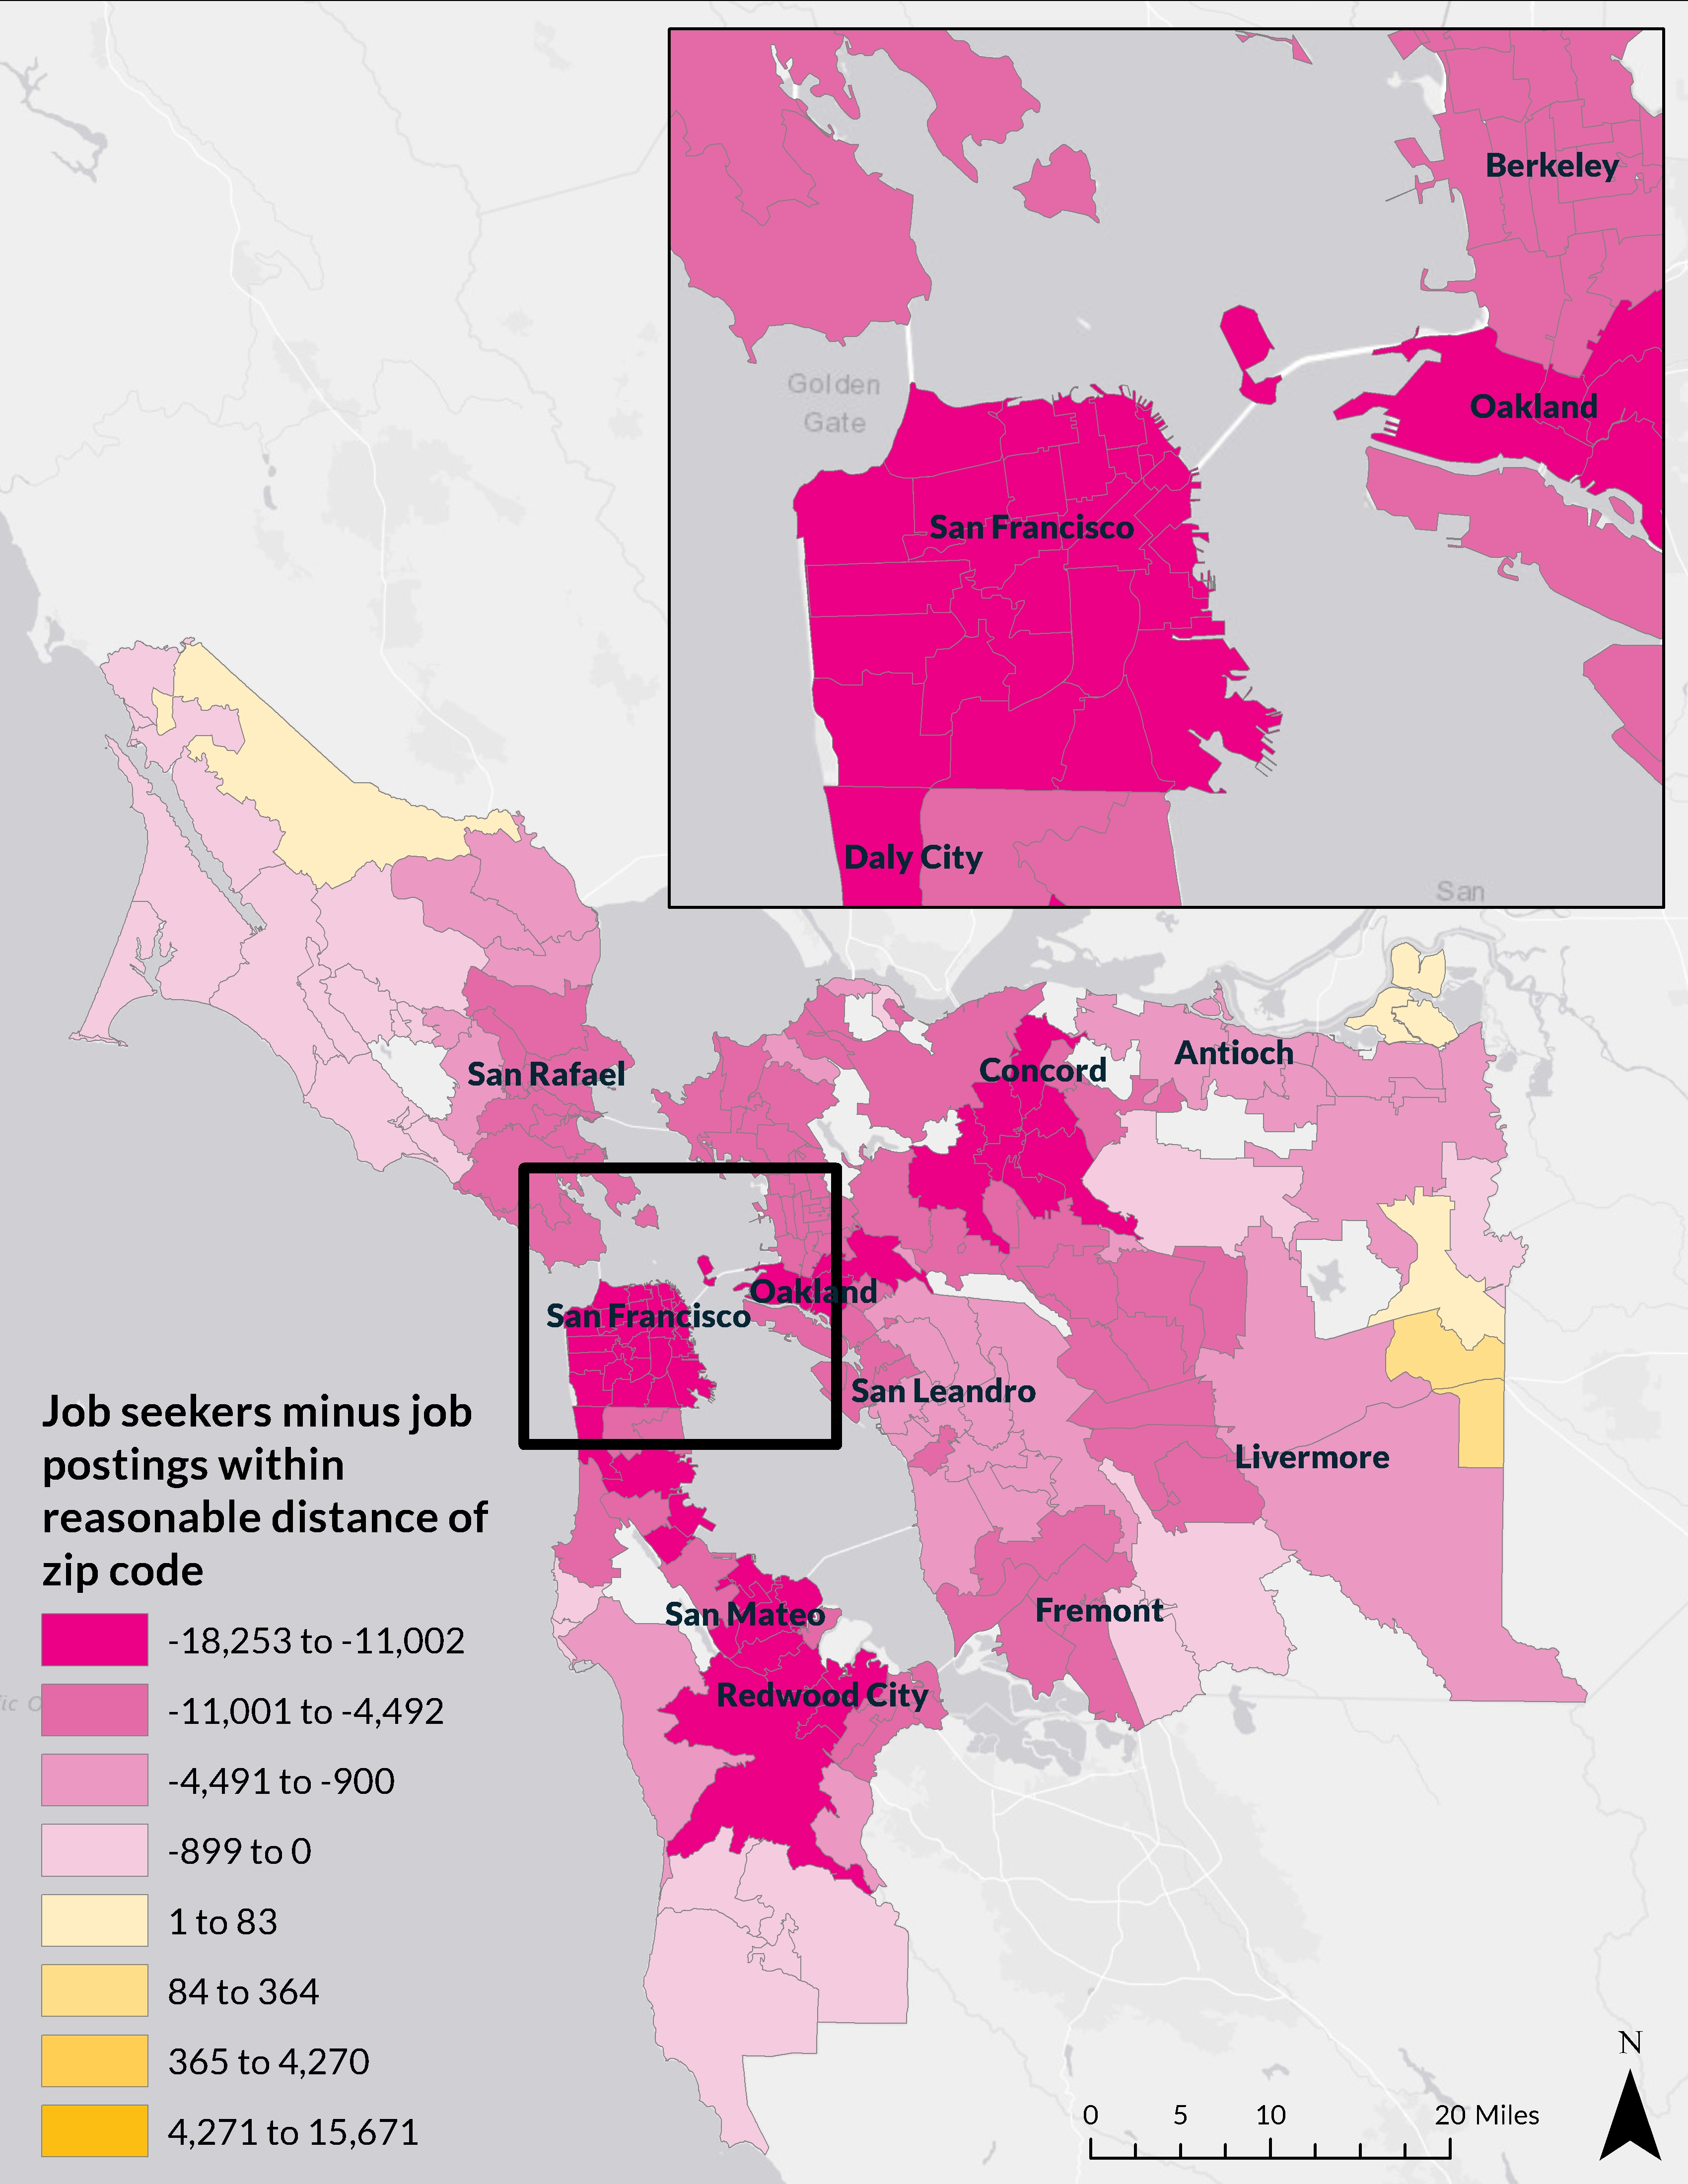
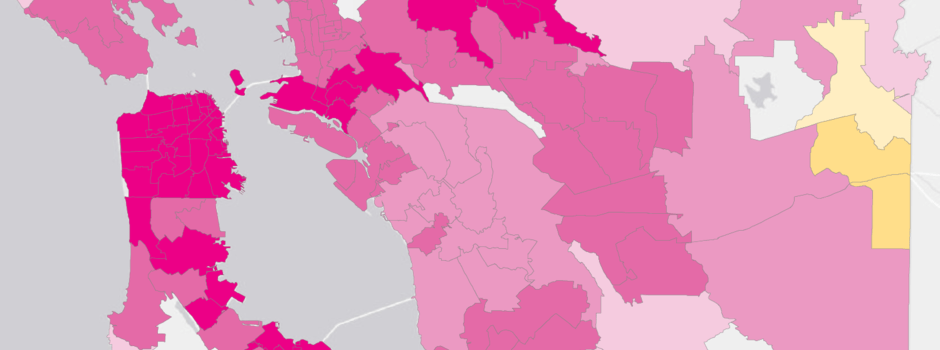
To dive deeper into these numbers, the slider map below shows the breakdown of job postings and job applicants within a reasonable distance of each zip code in the Bay Area. Subtracting the number of job seekers from the number of job postings gives us our mismatch measure.
Job Postings and Job Seekers in the San Francisco Bay Area, 2017
In the comparatively less populated region around Columbus, Ohio, a different story emerges. Like the Bay Area, the Columbus region has areas with an overabundance of Snag jobs and an undersupply of Snag applicants within a reasonable radius of those jobs (represented in dark pink). But Columbus also has pockets where job seekers outnumber job postings within a reasonable distance from their homes (represented in gold).
Snag data, however, contain mostly retail and service industry jobs and may undercount industrial and logistical distribution jobs, which are prevalent in Columbus.
Much of the oversupply of Snag jobs can be found in the northern part of the city (see the inset map) and in the close northern suburbs, while the oversupply of applicants is generally located in the southern part of the city.
“There’s this perception that all the jobs are in the suburbs,” said Steve Schoeny, director of Columbus’s Department of Development. “In reality, there are just as many jobs, or more, in the central core city. And so it’s about how do you connect people to those jobs within the core city, rather than how do we continue this pattern of sprawl?”
Spatial Mismatch in the Columbus, Ohio, Region, 2017
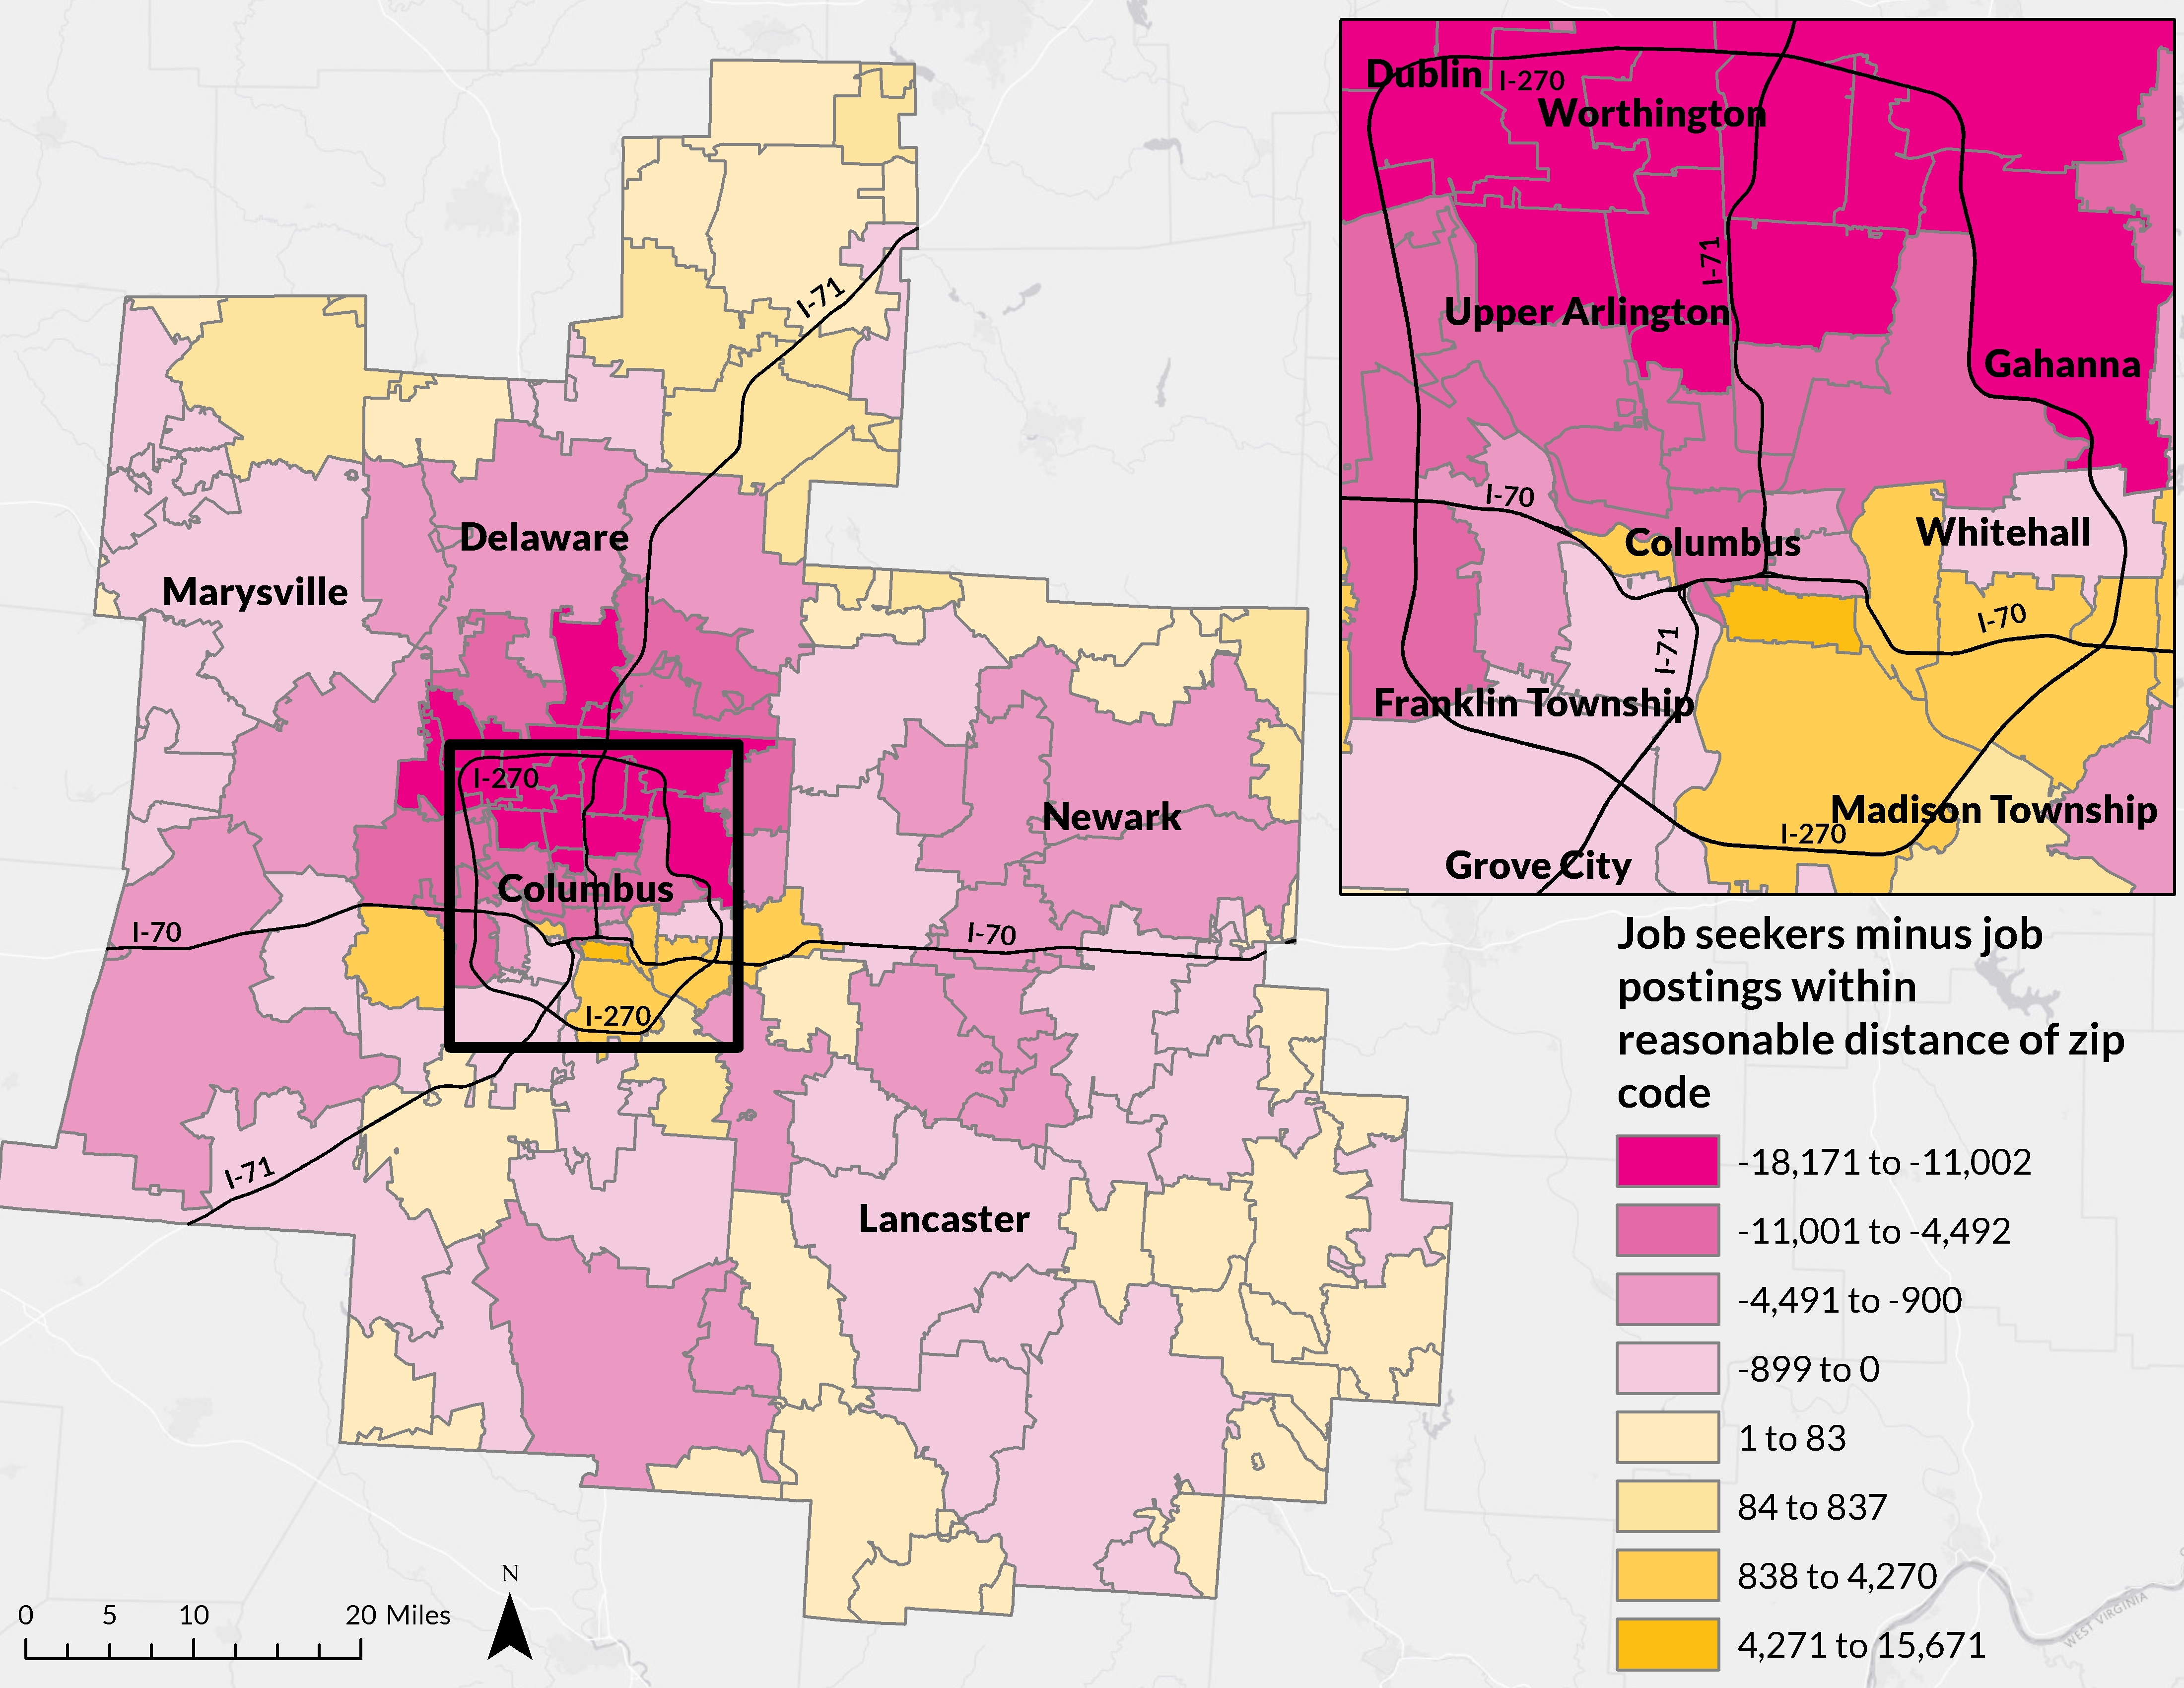
Job Postings and Job Seekers in the Columbus Region, 2017
Spatial mismatch is pervasive
Spatial mismatch isn’t limited to San Francisco and Columbus. Across all the cities in our sample, spatial mismatch for Snag users is pervasive.
The chart below shows Snag spatial mismatch rates for 16 large MSAs. For each, we show the share of zip codes in 2017 where Snag job postings far exceed job seekers (which is a problem for employers) and the share of zip codes where Snag job seekers far exceed job postings (which is a problem for job seekers).
Spatial Mismatch (Applicants Minus Postings) in 2017 across 16 MSAs
What cities are doing to overcome spatial mismatch
To resolve spatial mismatch, some cities and regions have found ways to connect low-wage workers with good jobs. Successful strategies may decrease the distance between job seekers and employers or improve the quality of jobs so that job seekers are willing to commute longer distances to get to them.
- Strengthening career pathways
Many of the jobs that go unfilled because of spatial mismatch are in the service industry. Bob Lanter, executive director of the California Workforce Association, said that potential workers often don’t see long-term growth potential in these jobs and aren’t willing to travel far for this type of work.
As a result, employers often have difficulty finding qualified job seekers, particularly in high-priced and gentrifying neighborhoods. And once they do make a hire in these circumstances, long-term retention becomes the next hurdle.
“[Employees] see it as a first job. Or they see it as a supplemental-wage job, but they don’t see it as a career job,” Lanter said. “Those jobs are typically harder for us to fill unless we can convince the business and the job seekers that there’s a career pathway attached to it.”
San Francisco, and California more broadly, are attempting to solve this problem by turning these jobs into a step along a full career ladder. With proper training and opportunities for career advancement, distant entry-level jobs may be career stepping stones, making a longer commute worth the effort. For example, Anaheim is working across the hotel industry to train workers and provide career ladders across the whole industry.
“The strategy in Anaheim…is to work with the hotels and have them develop a move-up strategy for their current entry-level workforce, getting them additional training so that they can move into midlevel management [and] higher-paying jobs,” Lanter said. - Creating housing near jobs and transit
At its core, much of spatial mismatch stems from residential and land-use patterns. A long-term strategy for addressing these issues is to make intentional decisions about housing and land-use policy. Columbus is combating spatial mismatch by creating and preserving affordable housing that would allow low-income workers to live closer to jobs, strategically increasing density, and creating more housing along transit lines and in areas with many employment opportunities.
The City of Columbus and Franklin County are in talks to create a new community land trust throughout the county. In its first year, the trust could build 30 new affordable homes on land-banked lots. The city government is also beginning a top-to-bottom review of its zoning code to refocus development in growth corridors, which would contribute to a modestly dense city footprint and move away from sprawl-based patterns.
Minneapolis will provide an important example and test case going forward. In December 2018, the city approved a comprehensive plan to abolish single-family zoning and allow three-unit buildings in any residential neighborhood. This is a novel and bold approach to zoning that could drastically increase affordability and reduce spatial mismatch between employers and job seekers. - Improving access to public transit
Columbus is also tackling spatial mismatch through transportation initiatives that aim to shorten the distance between jobs and workers. The Central Ohio Transit Authority (COTA) began this work in 2014 by starting a free circulator connecting German Village, an area where many service employees live, to Short North, an area with many service job openings. The connector also zeroed out commuting costs for these workers, significantly boosting take-home pay.
In June 2018, COTA, in conjunction with the Mid-Ohio Regional Planning Commission and the Capital Crossroads Special Improvement District, began a three-year pilot giving free bus passes to all workers with jobs in the downtown area. This program aims to address spatial mismatch and to decrease congestion and parking issues in America’s largest city with a bus-only transit system.
Another piece of the puzzle came through a new US Department of Transportation grant connecting people in low-income neighborhoods to high-opportunity neighborhoods. The grant funded an autonomous circulator bus between Linden (an area of low economic opportunity) and Easton (one of Ohio’s largest job centers).
Although these strategies can make large strides toward alleviating spatial mismatch, ultimately businesses will have to ensure that their jobs are attractive to potential employees. This might be through fair and predictable scheduling (many hourly jobs have unpredictable and irregular hours), improved benefits packages, transportation incentives, or higher wages. Localities can provide businesses incentives to adopt these behaviors through the tax code or other regulatory measures, such as increases to the minimum wage.
“There are examples of industry really coming to the table because they’re hurting for workers,” Lanter said. “It’s a job seeker market right now. Workers can pick and choose because so many businesses are having trouble finding people.
“The willingness for industry to strategize and work through some of these problems is ripe. [And] we need businesses who are willing to invest in their communities and their people.”
PROJECT CREDITS
This feature was funded by the Urban Institute’s Fleishman Innovation Fund. We are grateful to all our funders, who make it possible for Urban to advance its mission.
Data for this analysis come from Snag and consist of each job seeker, job posting, and job application for every entry in its system for 16 metropolitan areas for the years 2013–17.
To calculate spatial mismatch, we first draw a buffer around each zip code’s population-weighted centroid of 6.3 miles, the average distance between each job seeker and job posting for all applicants in our data. We then sum all job postings in that buffer in each year and subtract from that all job seekers in that buffer in each year. The larger this number, the greater the employer spatial mismatch; the smaller the number, the greater the job seeker spatial mismatch. We calculate the population-weighted centroid for each zip code by taking population counts from the American Community Survey at the census block group level and geospatially calculating the mean center of each zip code weighted by the distribution of population by census block group.
RESEARCH: Christina Stacy, Terry-Ann Craigie, Brady Meixell, Graham MacDonald, Sihan Vivian Zheng, and Christopher Davis
DESIGN: Christina Baird
DEVELOPMENT: Ben Chartoff
EDITING: David Hinson
WRITING: Christina Stacy, Brady Meixell, and Serena Lei