Over the last few years, as public attention has focused on disparities caused by structural racism embedded in policy and practice throughout United States history, redlining has emerged as an illustrative policy of structural barriers to homeownership and wealth-building opportunities.

A Home Owners Loan Corporation map from 1937 shows how areas in Baltimore were graded on their lending “riskiness,” with the redlined areas concentrated downtown. (Image courtesy of the Johns Hopkins Library)
The reasons for that emphasis are clear: Redlining—a practice starting in the late 1930s in which multiple real estate and public sector actors developed and adopted color-coded maps to identify areas’ “riskiness” for housing investment and mortgage lending—relied explicitly on racist assumptions. For decades, until the Fair Housing Act of 1968, redlining legally blocked groups of people (especially Black households and other households of color) from homeownership opportunities based on race, ethnicity, and religion. And, while many historical racist real estate practices are difficult to track, scholars’ work to share the 1930s-era Home Owners Loan Corporation (HOLC) city-specific maps with the public has made the practice visually tangible and stark.
But even though redlining codified multiple exclusive and racist housing policies and practices already in place during the first half of the 20th century, it was just one piece of a much broader combination of discriminatory housing policies and practices (including those that continued even after the Fair Housing Act was enacted). Other racist policies included racial covenants, GI Bill home loans, private lending practices, urban renewal projects, and zoning regulations. And, while HOLC maps are the most visible discriminatory maps, they were not the only map-based practices. The Federal Housing Administration had their own set of graded maps that were used to drive racist lending policies, but the agency destroyed its maps in 1969, so researchers don’t know whether they were the same as the HOLC maps.
All of these policies and practices have affected present-day patterns of segregation and inequality, and they have played out differently across regions, cities, and neighborhoods in the US. Looking at redlining in a vacuum ignores the complex web of policy choices that have evolved over time to create each region’s present-day landscape of population trends and housing challenges. And looking only backward can distract from the fact that restricting housing access based on race continues today.
Research Shows Redlining Is Just One Piece of a Bigger Story
Our recent research highlights the limitations of looking at only historical redlining’s impacts on present-day housing instability without considering the broader landscape of discriminatory housing policies and practices. For more than 200 US cities, we compared areas that were marked red (or “high-risk”) in the 1930s HOLC maps with areas where present-day rental housing instability is highest (using Urban’s Emergency Rental Assistance Priority Index and eviction filings data from the Eviction Lab).
We found that, nationally, historical redlining does not consistently correlate with present-day housing instability among renters. Associations vary among cities, with some places seeing positive correlations between present-day housing instability and formerly redlined areas, and some seeing negative ones. But overall, most correlations are weak. We found that redlining is more strongly associated with measures of the built environment and hard infrastructure, which is consistent with other research on redlining’s impacts on temperature, tree cover, and air quality.
Because of a range of historical and ongoing discriminatory policies and practices, Black people and other people of color today are more likely to experience housing instability, are less likely to be homeowners, and are more likely to experience housing cost burden and eviction. Our findings suggest that while redlining contributed to the creation of modern-day patterns of housing instability, it alone is not responsible for historical racism’s far-reaching effects on the housing market.
As discourse around reparative policies picks up steam, some policymakers have explored using previously redlined areas to identify where to prioritize housing assistance and other funding. But our analysis shows that using only redlined areas is not the most effective way to reach people harmed by historical policies or to reach those most in need today. Instead, policymakers could focus on grounding their decisions in local contexts by using current measures of housing instability and considering the full spectrum of policies and practices that have excluded people from housing and economic opportunities.
Exploring Two Cities to Understand Neighborhood Change
To illustrate these local contexts, we look at Denver and Baltimore—two cities with distinct histories and challenges that have one key similarity that is common across the US: the descendants of people harmed by redlining practices in the 1930s don’t live in the same places today.
Denver: A Story of Population Growth and Priced-out Residents
When the HOLC redlining maps were drawn in the 1930s, Denver’s population was just below 290,000. In 2020, its population (spread out over expanding city limits over time) was nearly 740,000, with significant booms in the 1940s, 1990s, and 2010s.
The benefits of Denver’s growth haven’t been felt equally among residents. In fact, Denver was named the second-most gentrifying city in the US in 2020. Countless factors led to Denver’s present-day housing landscape, including the redevelopment of downtown, the addition of light rail, and efforts to draw large numbers of high-paid professionals to the mountain region. These public- and private-sector choices have sparked significant population growth and attention for the city, while also driving sky-high housing prices and displacement concerns for residents.
How the Black and White Populations Have Shifted over Time in Denver


Notes: Each dot represents 10 people. Redlined areas shown on the map include areas that were graded C “definitely declining” and D “hazardous” by the Home Owners Loan Corporation in the late 1930s. Population data come from sources that rely on the Census and reflect the way race was measured at the time of collection. More information on 1930 Census categories is available on the Census Bureau website. In the 2020 map, white and Black categories may include both non-Hispanic and Hispanic populations. Ideas about race have shifted over time and have made Census categories inconsistent, so we are unable to include other racial categories other than Black and white in these maps. A portion of northeast Denver, including Denver International Airport, is not shown in the 2020 map in order to keep the scale the same between the 1930 and 2020 maps.
Denver’s Black population, which rose from 2 percent of the total population in 1940 to a high of 13 percent in 1990, has declined in recent years to below 10 percent in 2020. (The Latine population climbed to 32 percent in 2000 and dipped in 2020, while the white population fell from 97 percent in 1940 to 55 percent in 2020.) Many Black residents have been priced out of downtown and have moved out to the more affordable suburbs near the Denver airport or to the neighboring city of Aurora.
No neighborhood illustrates the city’s evolution from the 1930s to today quite like Five Points. Located northeast of downtown Denver, Five Points was already highly segregated when the HOLC maps labeled it a “high-risk” redlined area. In fact, by 1930, more than 75 percent of Denver’s Black residents lived in the Five Points neighborhood, largely because of racial covenants that prevented Black people from buying homes in white neighborhoods. The “high-risk” designation denied Five Points residents homeownership opportunities and created substandard housing conditions like overcrowding.

David and Virginia Mallard stand in front of their store, Mallard's Grocery & Confectionery, in 1948, when Denver’s Five Points neighborhood was home to a thriving Black-owned business community. (Image courtesy of Denver Public Library Special Collections, ARL12)
But Five Points had significant strengths and a rich culture beyond its housing challenges. Nicknamed “the Harlem of the West,” Five Points had a vibrant jazz scene and a thriving Black-owned business community, especially along its Welton Street Corridor. Through the 1940s, Five Points’ population continued to rise. But in the 1950s and 1960s, Black families had more options for where to live in Denver, as city, state, and federal policymakers started striking down racist housing policies like racial covenants. Between 1950 and 1970, as thousands moved out of Five Points to neighborhoods with newer homes and bigger lots, the population fell by half.
Many of the remaining older homes in Five Points were torn down in the 1980s and 1990s, and private and public redevelopment shaped the neighborhood in the 2000s, with new high-rise apartment and condo buildings aiming to attract new residents. This redevelopment sparked a gentrification wave, pricing many Black and working-class residents out of the neighborhood—because they couldn’t afford either the skyrocketing rents or the ballooning property taxes. Today, white residents are the largest racial group in Five Points, and the median home listing price is nearly $600,000.
Not only did the neighborhood’s population change, but so did its name—at least to some. In the mid-2000s, local artists coined the term RiNo (short for River North) to describe the new art and warehouse district within the Five Points boundaries, and the nickname spread. Many real estate agents now describe properties in the area as being in the “up-and-coming RiNo neighborhood,” ignoring the rich history and culture of Five Points—and the fact that it was designated a Historic Cultural District to preserve its cultural identity and acknowledge its importance to Denver’s Black community.


“It’s disheartening when you read these realtors calling the neighborhood ‘up-and-coming,’” said Terri Gentry, a Denver native. “They've got a very specific focus on who they're trying to bring into the neighborhood to buy these properties.”
Gentry has deep roots in Denver, with ancestors on both sides of her family moving to the city in the early 1900s. Her great-grandfather was the first licensed Black dentist in Colorado, operating in Five Points and in the adjacent Whittier neighborhood. Gentry has focused on making sure community members know about the Black history of the neighborhood through her work as a volunteer docent and board member at the Black American West Museum and Heritage Center and as the engagement manager for Black communities at History Colorado.
With gentrification, we've lost a lot of what made the Five Points neighborhood—the businesses, the people—we've lost a lot of that. And unfortunately, a lot of the folks that have come into the neighborhood don't connect to that history.
“With gentrification, we've lost a lot of what made the Five Points neighborhood—the businesses, the people—we've lost a lot of that. And unfortunately, a lot of the folks that have come into the neighborhood don't connect to that history,” she said. “I love to celebrate this history in our community and all the people that I grew up with, and all of the folks they were connected with. It's just such an important story to talk about all of these wonderful histories that we have in this community.”
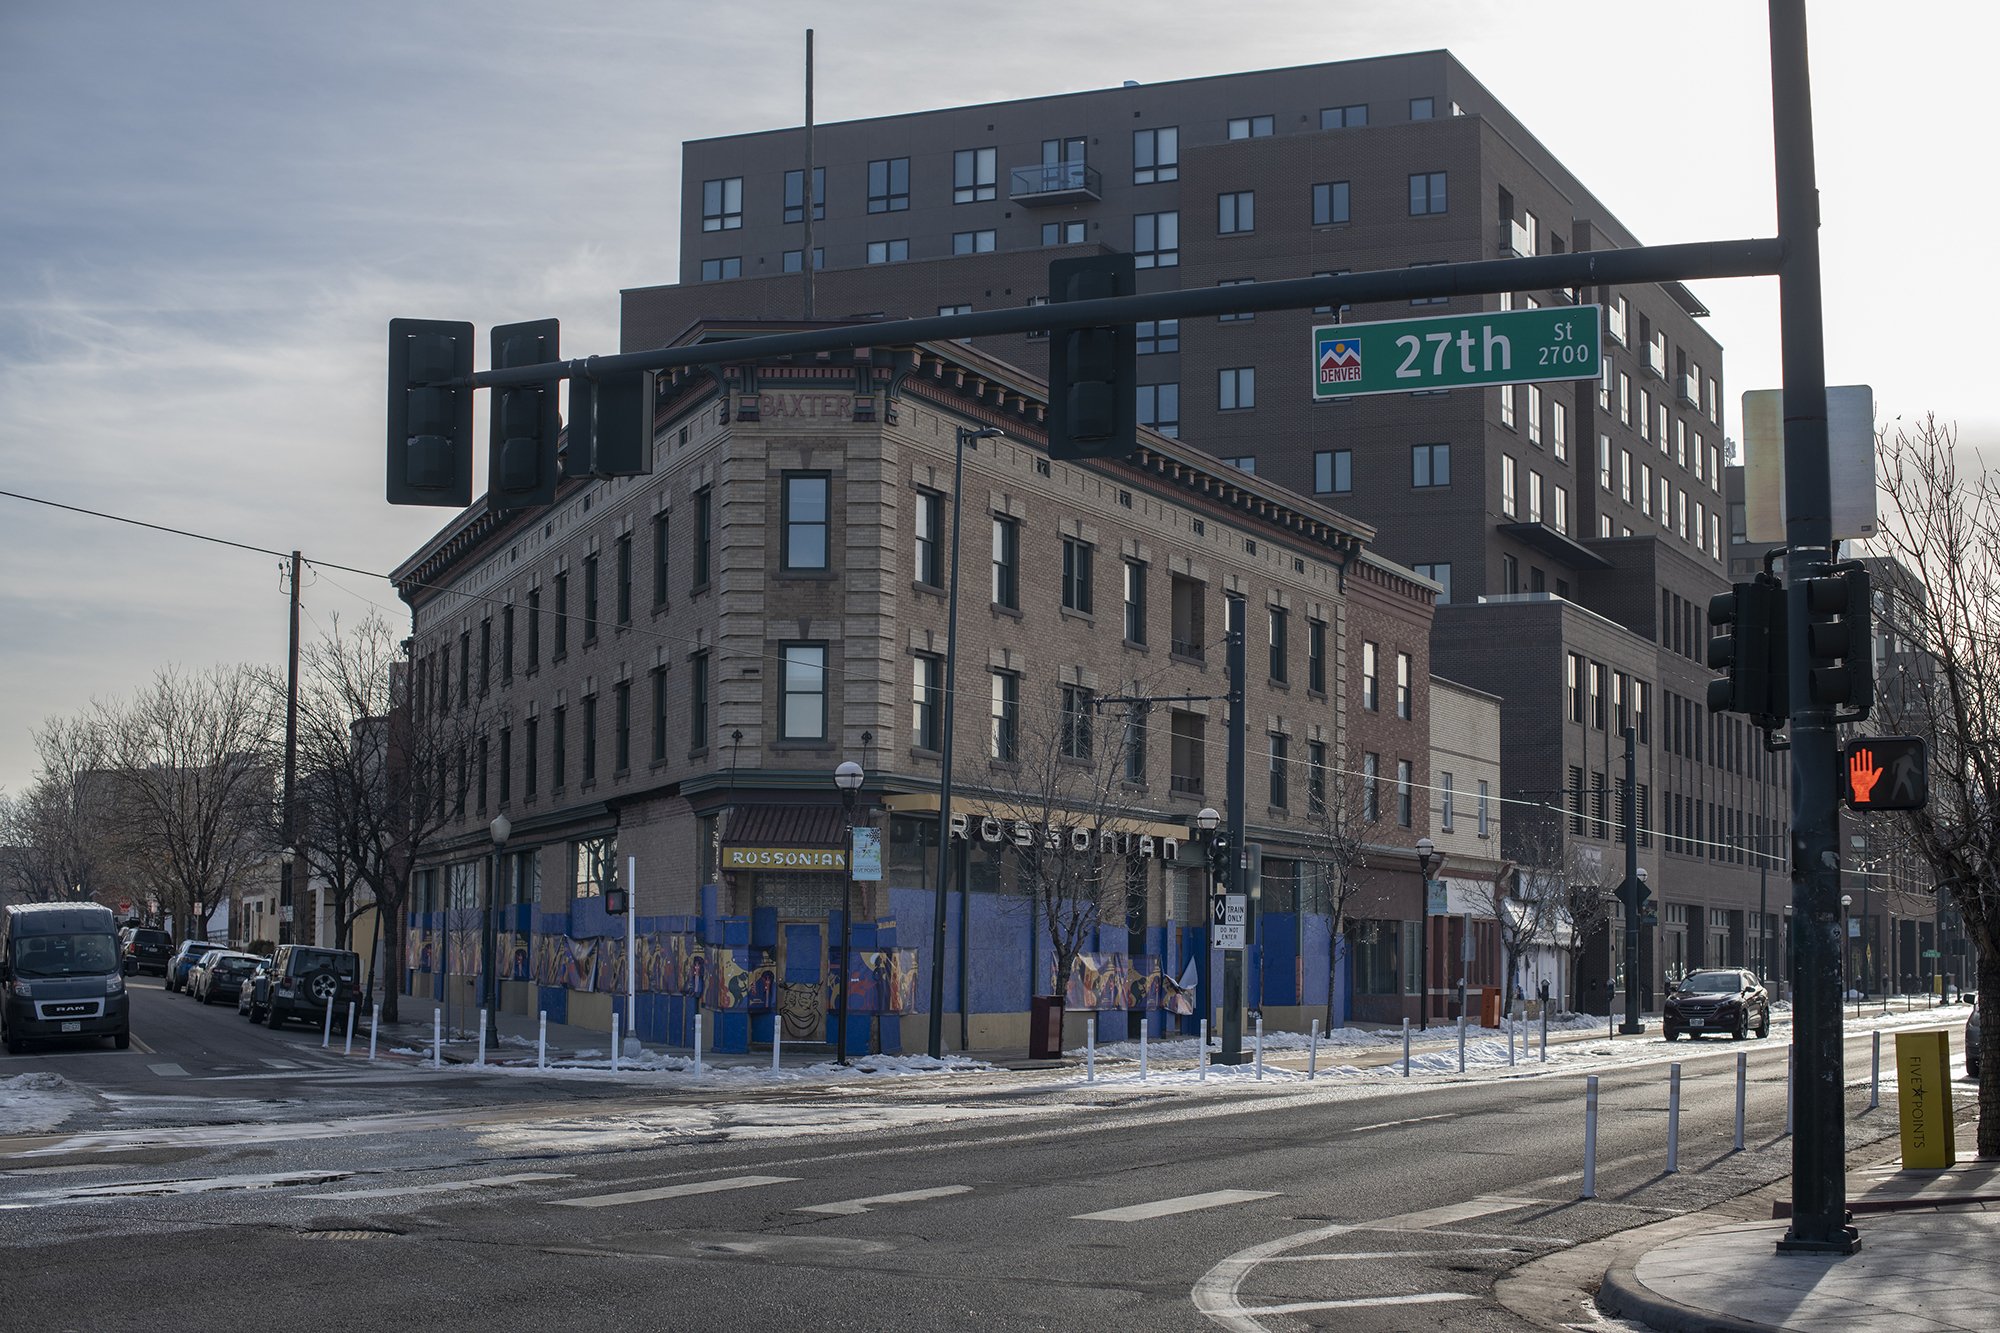
In the 1930s and 1940s, the lounge at the Rossonian Hotel in Denver’s Five Points neighborhood was considered one of the best jazz clubs in the Western US. In the mid-twentieth century, as Black residents left the neighborhood and the lounge stopped being able to attract top talent, the Rossonian saw several changes in ownership, ultimately closing. The building has been closed for decades, but a new developer has plans to restore the building and reopen it as a boutique hotel. (Photo by Rachel Woolf for the Urban Institute)
But, like countless residents before her, Gentry was priced out of her former northeast Denver neighborhood in the 1990s and now lives in the suburbs, more than 20 miles south of Five Points. “I work in Denver, but I can’t afford to move back in,” she said.
Baltimore: A Story of Population Loss and Redevelopment
Unlike Denver, Baltimore has seen significant population loss since the HOLC maps were drawn in the 1930s. Baltimore was the sixth-largest city in the country in 1930, with more than 800,000 people. By 2020, it had fallen to the 30th-largest city, with 583,000 people.
But even when Baltimore’s population was booming as people flocked to the transportation hub in the first half of the 20th century, racist policies and practices created an intensely segregated city. In 1911, decades before redlining was established, Baltimore implemented the nation’s first housing discrimination ordinance directed at Black people, preventing Black residents from moving into certain white neighborhoods.
The US Supreme Court struck down that type of discrimination in 1917, but local policymakers, mortgage lenders, and other real estate actors used other tactics to segregate Black and white people, such as racial covenants and racial steering. Redlining reinforced these disparities by barring Black families from accessing homeownership and limiting investment in majority-Black neighborhoods.
In the subsequent decades, Black people’s share of the city population rose as white residents moved to the suburbs—a result of economic and social incentives to suburbanize, efforts to avoid integrated neighborhoods, and segregating practices such as blockbusting. As white residents left the city, Black residents continued to move to neighborhoods beyond those that were redlined in the HOLC maps.
How the Black and White Populations Have Shifted over Time in Baltimore


Notes: Each dot represents 10 people. Redlined areas shown on the map include areas that were graded C “definitely declining” and D “hazardous” by the Home Owners Loan Corporation in the late 1930s. Population data come from sources that rely on the Census and reflect the way race was measured at the time of collection. More information on 1930 Census categories is available on the Census Bureau website. In the 2020 map, white and Black categories may include both non-Hispanic and Hispanic populations. Ideas about race have shifted over time and have made Census categories inconsistent, so we are unable to include other racial categories other than Black and white in these maps.
Since 1950, Baltimore’s population has consistently fallen. Between 2010 and 2020, the city’s population declined nearly 6 percent, with decreases in the shares of white and Black residents and increases in the shares of Latine and Asian residents.
As a result of ongoing population loss, the city has faced significant housing vacancy challenges in disinvested neighborhoods. This has led to a wave of redevelopment efforts in which the city or private developers tear down existing homes—some vacant, some not—and rebuild new residential and commercial space. But, like Denver, the benefits of redevelopment are not distributed equally. In fact, the Baltimore Community Change project found that some of the neighborhoods that are growing the fastest and have the highest share of white residents today—such as Canton and Federal Hill—are in formerly redlined areas.

The East Baltimore Development Initiative involved moving hundreds of families out of the Middle East neighborhood in Baltimore in the early-mid 2000s, tearing down homes, and redeveloping the area. Now, the neighborhood is known as Eager Park, and new condos and townhomes line the streets. (Photo by Rhiannon Newman for the Urban Institute)
One of the biggest examples of redevelopment in Baltimore, and in the country, is the East Baltimore Development Initiative (EBDI). In 2003, several stakeholders led by Johns Hopkins University created the EBDI with the goal of investing $1.8 billion in the 88 acres adjacent to the Johns Hopkins campus to build new residential, commercial, and biotech spaces. That neighborhood, known as Middle East—or, more recently, Eager Park—is a formerly redlined area that was facing disinvestment, high poverty rates, high crime rates, and a declining population in the years before EBDI started.
The massive project involved relocating more than 700 families from their homes (most of which were then torn down), providing financial assistance for them to rent or buy homes in other areas, and creating a right to return for those families when redevelopment was finished. But because of delays caused by multiple national economic downturns, the project has taken significantly longer than expected and is still under construction. Few relocated families have returned to the neighborhood, and less than a quarter are interested in coming back (for reasons such as higher housing costs and satisfaction with their new neighborhoods).

Ernest K. Smith has seen this all happen firsthand. Smith—a lifelong Baltimore resident, treasurer of the McElderry Park Community Association, and community adviser for the East Baltimore Research Project—lives near the EBDI site and has witnessed the extreme transformation of both the built environment and the sense of community.
“Many of these families were interconnected. They were extensions of each other and were each other’s support systems,” Smith said. “In that one area of EBDI, I could not walk more than five houses without running into someone I knew. There was always a place to stop. And when those people were scattered, the things that were the glue that held the community together, for many of these people, they no longer existed. They had to start all over.”
As new developments happen and our city changes, we have to figure out how we can make sure the community leads these efforts.

The East Baltimore Development Initiative established a new park, Eager Park, in the middle of the Eager Park neighborhood in Baltimore. The development area is adjacent to the Johns Hopkins campus and has a mix of residential, commercial, and biotech space. (Photo by Rhiannon Newman for the Urban Institute)
The EBDI may be an extreme example of a sudden neighborhood change, but it shows the importance and challenges of ensuring that the benefits of revitalization and investment efforts reach the community members harmed by past racist and exclusionary policies. The EBDI also demonstrates how many of the people most harmed by past policies don’t live in the same places they once did, because of other factors that have led to population movement and newer forms of exclusion and segregation.
“We have to realize that the ghosts of the past are still haunting us today,” Smith said. “As new developments happen and our city changes, we have to figure out how we can make sure the community leads these efforts. We want everyone to become part of the growth story of this wonderful city that I have grown both to hate and love all at the same time.”
Effective Policies Need to Understand How Places and People Change
Housing policy and practice has disadvantaged Black people and other communities of color in a variety of ways throughout history. Our analysis highlights why solely relying on place-based programs based on the 1930s HOLC maps is not an effective way to reach the people most harmed by those policies or those currently in need of assistance.
Instead, more effective tactics for policymakers considering ways to rectify the compounding harms of housing discrimination could include using current measures of housing instability combined with local data to target housing resources, and focusing reparative policies on the people most affected—rather than relying on fixed locations on the HOLC maps.
The City of Denver has taken this people-focused approach to addressing past harms with its metroDPA Social Equity Program. Launched in 2022, the program aims to promote homeownership among communities of color by providing up to $25,000 of down payment assistance to descendants of people who lived in redlined areas between 1930 and 2000.
Britta Fisher, the former chief housing officer of Denver, said the city intentionally chose 2000 as the end date to acknowledge how much has changed in Denver over the last two decades. She recognizes that although the program doesn’t have the resources to match the scale of the problem, it could be an example of how to design a program that sets the stage for future reparative work and could potentially spur similar work in other communities.
“Is it too little, too late? Sure. But it’s a start. A lot of what we do in government is proof point something that it can work, it can have the impact we’re desiring, then we fine tune,” Fisher said. “We’ll continue to iterate and get better, and that provides value not only to Denver residents but to those watching to see how they might make similar investments to make a difference in their communities.”
At its core, what is redlining? It’s the constricting of the flow of resources. If we take away the word ‘redlining,’ we currently have policies that restrict the flow of resources into neighborhoods.
In addition to rectifying past harms, policymakers also can focus on creating equitable policies today, as Black families and other people of color continue to face discrimination and disparities in access to opportunity. Other Urban work has found that majority-white neighborhoods in cities typically receive a disproportionate share of investment, preventing majority-Black neighborhoods from having access to the same economic, housing, and ownership opportunities.
“At its core, what is redlining? It’s the constricting of the flow of resources. If we take away the word ‘redlining,’ we currently have policies that restrict the flow of resources into neighborhoods. Resources are going to some neighborhoods and not to others,” said Seema Iyer, former director of the Baltimore Neighborhood Indicators Alliance–Jacob France Institute.
Iyer hopes policymakers and private institutions consider the consequences of present-day choices that continue to perpetuate disparities. “We should absolutely know the history, but we shouldn’t absolve ourselves of what’s happening today,” she said. “This is still happening and impacting our neighborhoods. We’re doing it right now.”
Read the research brief to learn more about how historical redlining patterns correlate with current risk of housing instability.
Data for the maps come from the following sources: The locations of formerly redlined areas are from the Home Owners Loan Corporation maps, which were digitized by the University of Richmond’s Mapping Inequality project. Population data for 1930 through 1990 are from Brown University’s Diversity and Disparities website and Urban Transition Historical GIS Project; from the research paper “From Side Street to Ghetto: Understanding the Rising Levels and Changing Spatial Pattern of Segregation, 1900-1940”; from the article “Interpolating U.S. Decennial Census Tract Data from as Early as 1970 to 2010: A Longitudinal Tract Database”; and from the article “Validating Population Estimates for Harmonized Census Tract Data, 2000–2010.” Population data for 1990 through 2020 are from the American Community Survey five-year estimates.
PROJECT CREDITS
This story was funded by the Melville Charitable Trust and the Conrad N. Hilton Foundation. We are grateful to them and to all our funders, who make it possible for Urban to advance its mission. The views expressed are those of the authors and should not be attributed to the Urban Institute, its trustees, or its funders. Funders do not determine research findings or the insights and recommendations of our experts.
We would like to thank Alicia Mazzara, Peggy Bailey, and Will Fischer from the Center on Budget and Policy Priorities; Ann Oliva from the National Alliance to End Homelessness; Mary Cunningham and Bill Pitkin from the Urban Institute; and Matt Gerken and Ajjit Narayanan, formerly of the Urban Institute, for their support and feedback over the course of the development of this project.
RESEARCH Emma Fernandez, Katie Fallon, Brendan Chen, and Samantha Batko
DATA VISUALIZATION Szu Yu Chen (https://chenszuyuuu.github.io/)
EDITING Lauren Lastowka
PHOTO EDITING Rhiannon Newman
PHOTOGRAPHY Rhiannon Newman and Rachel Woolf (https://www.rachelwoolfphotography.com/)
PRODUCTION Jerry Ta
WRITING Emily Peiffer