Body
Data visualizations to inform decisions and shape policy
Content Reference

Timely data on Americans’ finances and the cost of basic needs by state and congressional district.
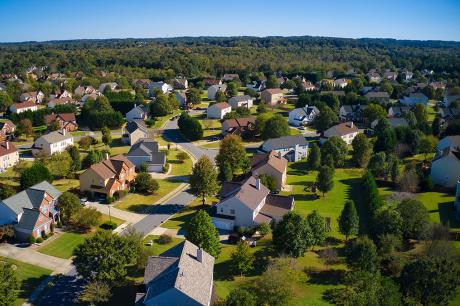
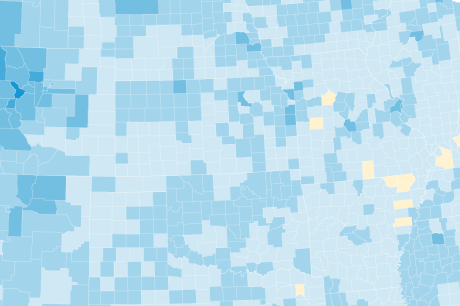
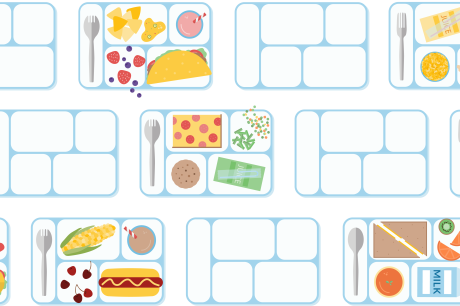
Data Tool Tracking Homeownership Wealth Gaps Search for your city to see how housing wealth is distributed where you live.Data Tool The Gap between SNAP Benefits and Meal Costs, 2020–2021 More than 42 million Americans participate in SNAP, but the maximum benefit falls short of a modestly priced meal in many US counties.Data Tool Measuring Student Poverty: Dishing Up Alternatives to Free and Reduced-Price Lunch For decades, state policymakers and researchers have used receipt of free and reduced-price lunch as a way to estimate student poverty, but changes to the program have made it a less reliable proxy.
Data Tool Reenvisioning Rural America How to invest in the strengths and potential of rural communitiesData Tool Where Low-Income Jobs Are Being Lost to COVID-19 Which neighborhoods are most vulnerable to COVID-19 job losses? Our estimates can help nonprofits, foundations, and government target support where it’s most needed.
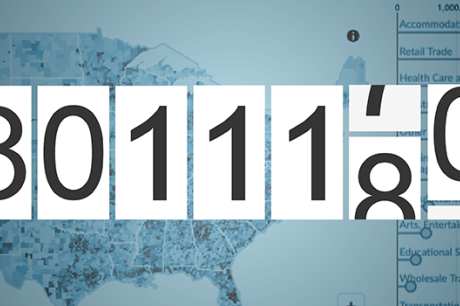
Data Tool Gauging Investment Patterns across the US How much capital is flowing to your city, county, or state, and how evenly is it distributed across neighborhoods?