
Every day, more than 9,000 Americans turn 65. This new generation of older Americans will confront different challenges than its predecessors, but it will also enjoy new opportunities. Using data and projections pulled from DYNASIM, household surveys, and the federal government, these charts show how ongoing demographic, economic, and social changes are transforming the older population and future retirement prospects.
The older population is soaring.
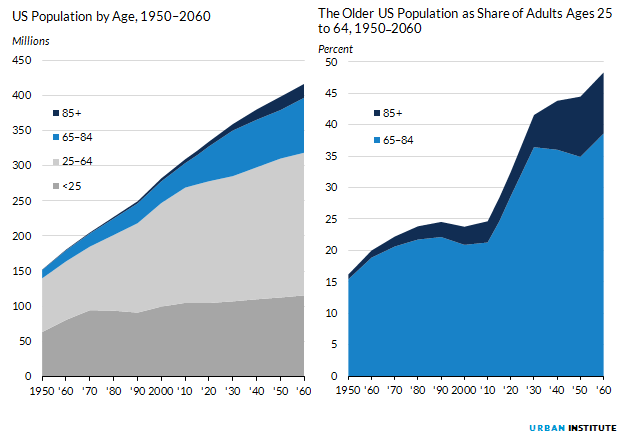
Sources: US Census, 2012 National Population Projections; US Census population data.
Forty-eight million Americans were age 65 and older in 2015, 18 percent more than just five years earlier. The number of older Americans will increase to 74 million by 2030, and 98 million by 2060.
The population older than 65—which is mostly retired—is growing much more rapidly than the population younger than 65—which is mostly working. As a result, each worker will have to pay a larger share of the support provided to retirees through Social Security, Medicare, Medicaid, and other public services. In 2010, there were 0.25 adults age 65 and older for every adult ages 25 to 65. By 2060, that ratio will nearly double to 0.48. This burden could shrink somewhat, however, if older adults retired later.

Source: Unpublished data from the Social Security Administration.
Why is the population getting so much older? Partly because the baby boomers—the unusually large generation born between 1946 and 1964—are reaching old age, but mostly because people are living longer and having fewer children. Between 1920 and 1980, life expectancy at birth increased 17 years for men and 14 years for women. These gains resulted from mortality reductions across the lifespan. For example, men turning 65 in 2030 can expect to live six years longer than those who turned 65 in 1970. Over the same period, women’s life expectancy at age 65 increased four years. One consequence of this increased longevity is that retirement savings will have to last longer.

Source: National Vital Statistics report Births: Final Data for 2013, 64 (1); Vital Statistics of the United States, 2003, Volume 1, Natility, table 1.1; DYNASIM.
Note: The total fertility rate is the number of children a woman can expect to have over her lifetime.
Reduced fertility rates are also contributing to the increased share of the population older than 65. In 1957, when post–World War II fertility peaked, women in the United States averaged 3.8 children over their lifetime. In 2014, American women averaged just 1.9 children over their lifetime, not even enough to maintain the population.
Lower fertility directly affects aging families. Adult children provide much of the hands-on care for older adults who need help with basic activities. Yet nearly a fifth of women born after 1970 will not have any children, forcing them to rely on more distant relatives, friends, or paid helpers if they become frail and don’t have a spouse or companion.
The older population is becoming more racially and ethnically diverse.

Source: DYNASIM.
In 2000, non-Hispanic whites accounted for 81 percent of all adults age 65 and older. That share dropped to 76 percent by 2015 and will fall to 57 percent by 2060. Between 2000 and 2060, the share of Hispanics in the older population will nearly triple, increasing from 7 to 20 percent. This ethnic shift will have far-reaching consequences, because race and ethnicity influence lifetime earnings, wealth accumulation, health status, caregiving networks, and service needs.
However, the older population will remain less ethnically diverse than the younger population. In 2015, non-Hispanic whites accounted for 62 percent of Americans younger than age 65. By 2060, Hispanics and nonwhites will make up a majority of the nation’s younger population, forecasting more changes for the older US population toward the end of this century and into the next.
Over the coming decades, the share of older married women will rise, but the share of older married men will fall.

Source: DYNASIM.
As the gender gap in life expectancy shrinks, women will be less likely to outlive their husbands, reducing the share of widows in the older population. Despite rising divorce and never-married rates, older women will be more likely to live with a spouse in 2060 than they were in 2000. However, older men will become less likely to live with a spouse over time.
Marital status matters at older ages. Married couples share living expenses, and both spouses usually receive Social Security benefits and sometimes collect employer-provided pension benefits. Unmarried older women, for example, are about three times as likely to be impoverished today as their married counterparts. In addition to providing emotional support, spouses provide much of the hands-on care for older adults who need help with day-to-day activities.

Source: DYNASIM.
In coming decades, older men will still be more likely than older women to receive support from a spouse. Although widows will become less common, over the next half century, about half of women will spend at least 10 years without a spouse after age 65. About a third of men born in the 1980s—who will enter their 70s in the 2050s—will spend at least 10 years in old age without a spouse, up from about a fifth for men born 50 years earlier.
The older population is becoming better educated than ever.
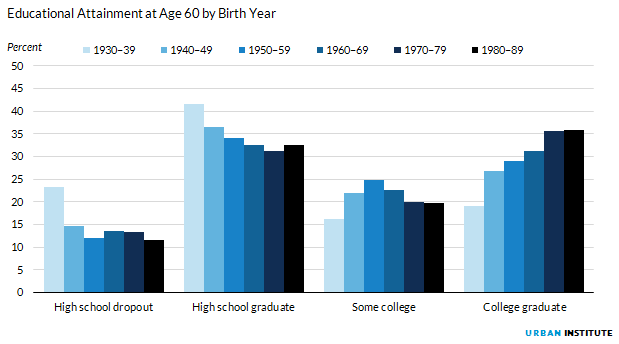
Source: DYNASIM.
People born in the 1980s—who will begin reaching their 70s in 2050—are only half as likely to lack a high school diploma as those born 50 years earlier. They’re also nearly twice as likely to have completed four years of college. Education matters at older ages, because better-educated people tend to earn more over their lifetimes, accumulate more wealth, and experience fewer health problems than people with less education.
Older Americans are getting healthier.

Source: Health and Retirement Study.
Between 1998 and 2012, the share of adults age 80 and older in fair or poor health fell from 43 to 34 percent. Better health can allow people to work longer and reduce Medicare and out-of-pocket medical costs.
But recent health declines among middle-aged adults may halt or reverse this trend. For example, between 1992 and 2010, the share of adults ages 51 to 54 reporting fair or poor health increased from 17 to 22 percent, as diabetes has become more widespread.
Traditional pensions are disappearing, but workers are saving more in employment-based retirement accounts.

Source: DYNASIM.
In the past few decades, the private sector has shifted away from traditional employer-sponsored defined benefit pension plans. These plans, which provide retirees with lifetime benefits typically based on how much they earn near the end of their careers and how long they work, covered 30 percent of adults born in the 1940s and 1950s. They will cover only 11 percent of adults born in the 1980s.
Defined benefit plans have been largely supplanted by 401(k)-type plans that allow workers to set aside part of their paychecks in tax-deferred savings accounts, generally supplemented by employer contributions. Workers can accumulate substantial savings in these retirement accounts, offsetting the loss of traditional pensions. DYNASIM projections show that the average combined value of retirement accounts and lifetime traditional pension benefits will be three times as high for 65-year-olds born in the 1980s as for their counterparts born 50 years earlier.
But retirement accounts don’t accumulate automatically. Workers must choose to make significant contributions each pay period, invest the funds prudently, resist the temptation to dip into their accounts before they retire, and manage their funds wisely after they retire.
Women are earning more and accumulating more retirement savings on their own.

Source: DYNASIM.
Women’s movement into the labor force was one of the most important labor market developments of the second half of the 20th century. Women born in the 1930s earned only about a quarter as much as men over their lifetimes. That gap has been closing as more women work full time and earn more per hour. Women born in the 1970s will earn about 70 percent as much as their male counterparts over their lifetimes.
Although the gender pay gap persists, the rise in women’s lifetime earnings will substantially improve their retirement security as they receive more Social Security benefits, accumulate more wealth in their employers’ retirement plans, and set aside more money in other savings vehicles.
Older adults are working longer.

Source: US Bureau of Labor Statistics.
Better education and health have increased older adults’ employment prospects, jobs have become less physically demanding, and Social Security and pension rule changes have made work more financially rewarding at older ages. Between 1994 and 2014, the share of men participating in the labor force—those working or looking for work—increased from 45 to 56 percent at ages 62 to 64 and from 27 to 36 percent at ages 65 to 69. Over the same period, the share of women participating in the labor force increased from 33 to 45 percent at ages 62 to 64 and from 18 to 28 percent at ages 65 to 69.
Working longer boosts lifetime earnings, increasing Social Security credits and the amount of resources workers can use to save for retirement. It also shrinks the retirement period, so retirement savings do not have to last as long.
More older adults are retiring with outstanding debt.

Source: Health and Retirement Study.
Between 1998 and 2012, the share of adults age 65 and older with household debt increased from 30 to 44 percent. Twenty-four percent of older households had an outstanding mortgage in 2012, up from 16 percent in 1998. The prevalence of other types of debt, including credit card debt, has also grown over time. Moreover, the median debt level among older adults with outstanding debt increased 74 percent in inflation-adjusted dollars over the period, to $24,500.
As indebtedness grows at older ages, more families will have to devote part of their retirement income to servicing their debt, leaving fewer resources to meet routine living expenses.
Project credits
RESEARCH Richard Johnson and Karen Smith
EDITORIAL Nicole Levins and Elizabeth Forney
DESIGN Tim Meko
Wilda Jeanbart, center, and other seniors applaud as they get their first glimpse of President Barack Obama while watching the inauguration on a large screen television at Brooklyn's Fort Greene Senior Action Center in New York, Tuesday, January 20, 2009. Photo by Kathy Willens/AP