Estimates predict the recently passed reconciliation bill will cut Medicaid coverage for about 10.5 million people by 2034 (PDF) and lower Supplemental Nutrition Assistance Program (SNAP) benefits for all families. On their own, these cuts will cause hardship for the families who rely on these programs, and their communities will face increased pressure on local services, charitable organizations, and health care providers.
But many families receive benefits through both programs, meaning the cuts will cause those families to lose health insurance and necessary nutrition assistance. Using 2019–23 five-year American Community Survey (ACS) data, I find that most households reporting SNAP benefit receipt also report at least one person with Medicaid or Children’s Health Insurance Program (CHIP) health coverage. I also find that about one-third of households receiving Medicaid or CHIP report SNAP participation.
Overall, the ACS data show nearly 32 million households receiving Medicaid, about 15 million receiving SNAP benefits, and 12 million receiving benefits from both programs between 2019 and 2023. However, because surveys are known to undercount Medicaid and SNAP enrollment relative to administrative data, the true counts may be higher. If, using the ACS data, we assume an average household size of 2.5 people, there are roughly 30 million people receiving benefits from both programs.
About 12 Million Households Participate in Both SNAP and Medicaid
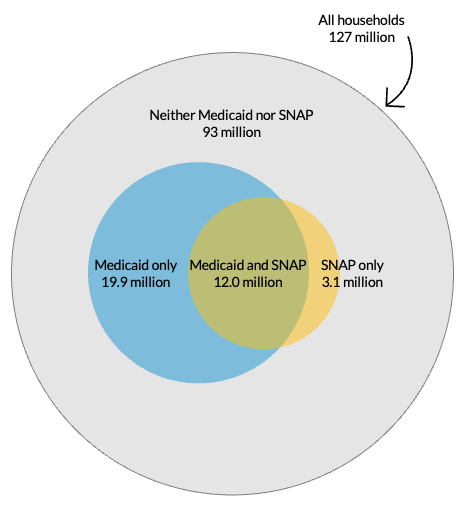
Source: Author’s calculations based on the 2019–23 American Community Survey.
Notes: SNAP = Supplemental Nutrition Assistance Program.
Understanding the limitations of the ACS data
Using the 2019–23 five-year ACS data to measure Medicaid and SNAP participation necessitates several important acknowledgments. First, Medicaid is measured at the individual level in the ACS while SNAP is measured at the household level. To create a consistent comparison across both programs, I aggregated Medicaid counts to household numbers, meaning a household is counted as receiving Medicaid if anyone in the household reports participation.
Second, the survey question about Medicaid participation also asks the respondent about participation in “Medical Assistance, or any kind of government-assistance plan for those with low incomes or a disability,” meaning the participation count could be broader than just Medicaid.
Finally, the ACS tends to underreport Medicaid and SNAP participation. Compared with the average number of households receiving SNAP benefits according to the Food and Nutrition Service, the ACS reports nearly 6 million fewer households (28 percent). For Medicaid, previous studies (PDF) found an undercount between about 6 percent and 9 percent between 2014 and 2019, and a significantly larger 15.5 percent undercount in 2021. The undercount in the 2019–23 ACS data is probably even higher owing to differences in the survey, time frame, definition of “household,” and the unwinding of Medicaid during the COVID-19 public health emergency, which expanded some provider flexibilities in the Medicaid program.
Where are households more likely to receive Medicaid and SNAP benefits?
Even with these caveats, understanding program overlaps can help policymakers see how reconciliation-related cuts may affect beneficiaries. Using the ACS data, I measure counts of Medicaid and SNAP participation (separately and jointly) at the state and Public Use Microdata Area (PUMA) level. PUMAs are US Census Bureau–designated areas within a state’s boundaries that contain at least 100,000 people. Because PUMAs are based on population density and not geographic area, they can vary in size.
Unsurprisingly, the most populous states report the greatest number of households receiving benefits from both programs: California (1.3 million households), New York (969,000), and Texas (925,000). But the share of households reporting receipt of both benefits were highest in New Mexico (16 percent), West Virginia (15 percent), and Louisiana (14 percent).
At the PUMA level, I find that areas in the Appalachian region (Eastern Kentucky, southeastern Ohio, and Southern West Virginia) have higher rates of per household joint Medicaid and SNAP participation, as do large parts of New Mexico, South Texas (along the US-Mexico border), and the Mississippi Delta, especially in eastern Louisiana and western Mississippi.
Large metropolitan areas also have higher rates of dual receipt. PUMAs in New York City, Philadelphia, Detroit, Miami, Detroit, Chicago, and Boston all have above-average shares of households reporting benefits from both programs.
Some broader geographic patterns emerge as well. In the nine South Atlantic states, stretching from Maryland to Florida, more than 6.6 million households receive Medicaid or SNAP benefits, and about 2.3 million receive benefits from both programs. Seven states in the northern Midwest and six states in New England have the fewest households receiving benefits from either program (1.8 million) and just 600,000 households receiving both benefits.
Looking forward
These estimates show at least 12 million American households participate not just in one program or the other, but in both. Benefit loss will adversely affect households’ health and nutrition and, in the long run, the US economy.
Let’s help communities build more secure, hopeful futures.
Today’s complex challenges demand smarter solutions. Urban brings decades of expertise to understanding the forces shaping people’s lives and the systems that support them. With rigorous analysis and hands-on guidance, we help leaders across the country design, test, and scale solutions that build pathways for greater opportunity.
Your support makes this possible.