The US Department of Transportation (DOT) invests billions of dollars each year into surface transportation, including for the construction and maintenance of highway, transit, pedestrian, and cyclist infrastructure. But funding has not always been evenly distributed among transportation modes and parts of the country. In this summary, we investigate how recent federal surface transportation spending has been distributed.
Why This Matters
Most DOT funding is distributed through formula programs, which are directed to states and transportation organizations, like transit agencies, to spend on the projects they prioritize. These formulas have remained largely unchanged for decades, but with programs up for reauthorization in 2026, there is an opportunity for policymakers to reevaluate how to distribute funds. These data also present an opportunity to assess whether programs distributed through agency discretion can be more effective at allocating funds to areas of need.
Key Takeaways
Formula programs dominated DOT surface transportation funding in fiscal years 2022 and 2023. About 31 percent of all spending was allocated to the National Highway Performance Program, which funds the National Highway System. The Surface Transportation Block Grant Program, which provides flexible transportation funding for states and localities, was the next largest program, distributing about 13 percent of all surface transportation funding. Federal law enables funds from these programs to be “flexed” for nonhighway uses by states and localities, though most recipients do not flex funds. We found the following:
- Highway spending—which accounts for most federal surface transportation funding—disproportionately funded less-densely populated areas with lower incomes, lower shares of people of color, and more drivers.
- Transit programs were more likely to fund more densely populated areas with higher shares of people of color. They also provided more funding to areas with higher governmental capacity in the form of more staff.
- On average, high-income areas received more transit funding than middle- and low-income areas, potentially preventing some communities from effectively serving their residents. Communities with lower tax bases may have difficulties attracting federal support to fund their public transportation systems.
Per capita outlays from federal transit programs, for the largest metropolitan areas, fiscal years 2022 and 2023
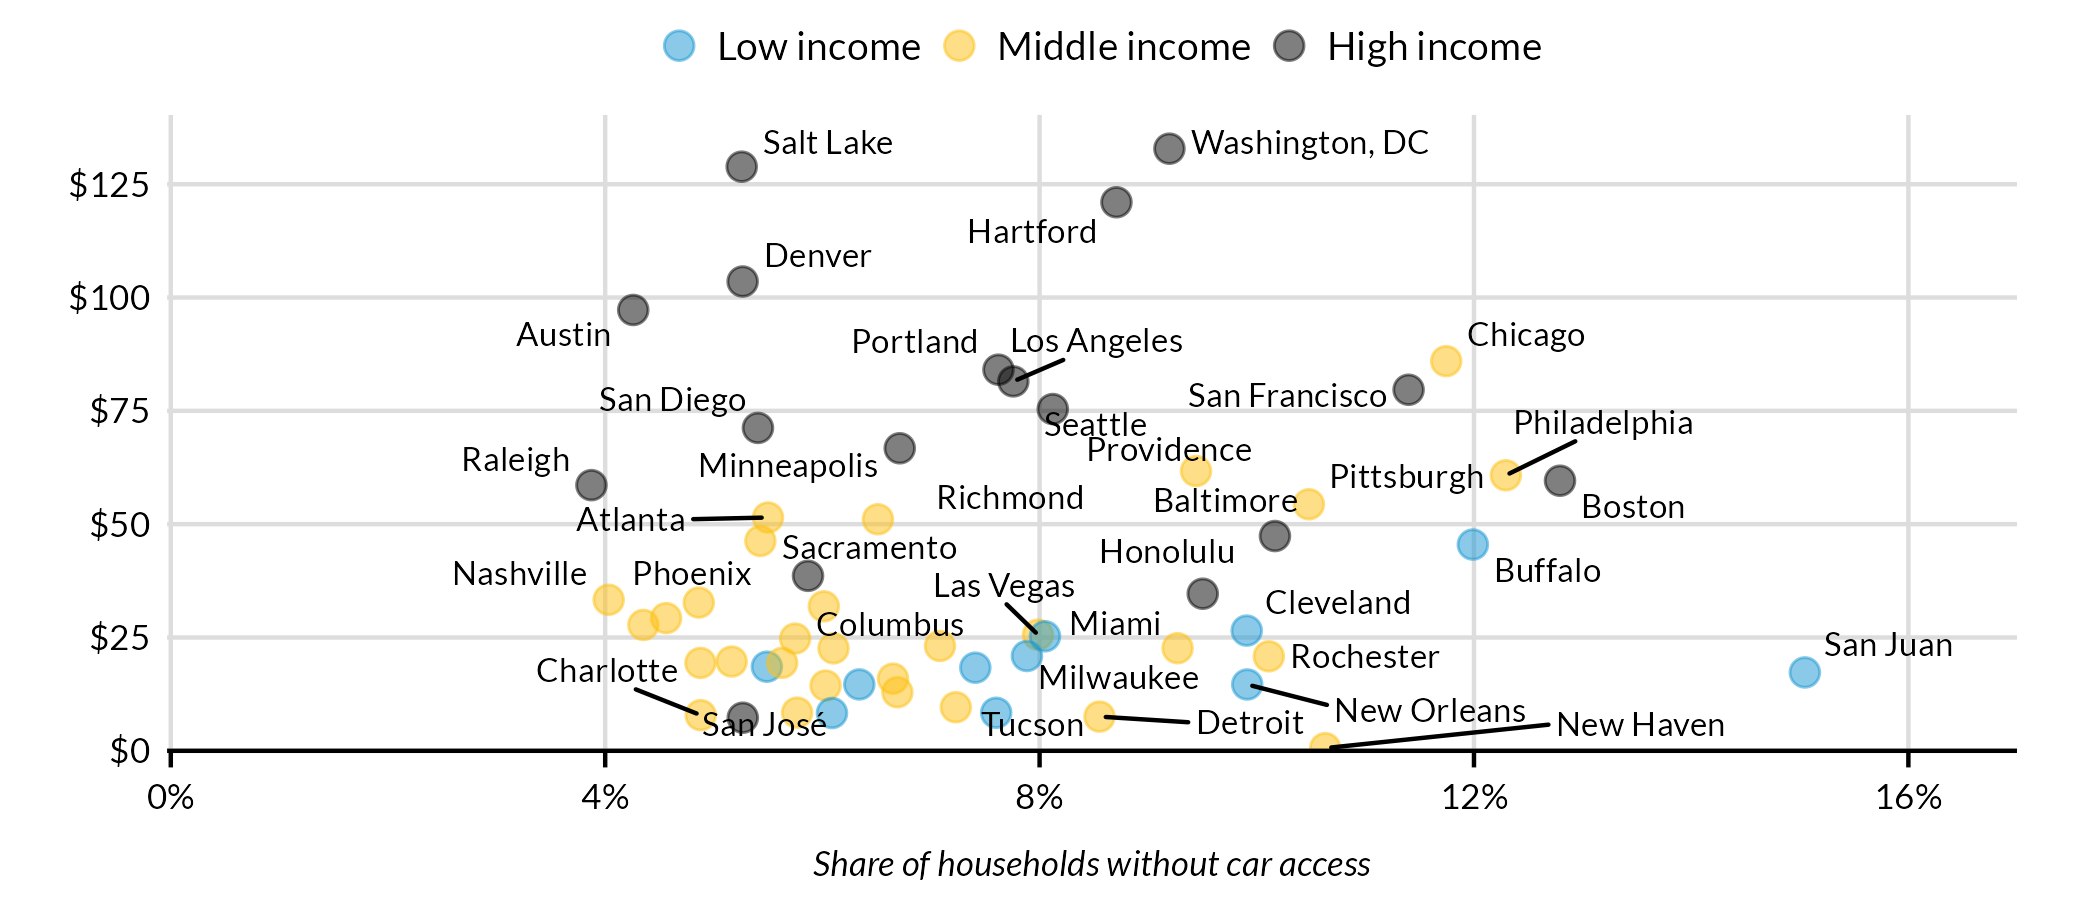
Source: Authors’ analysis of 2016–20 five-year American Community Survey estimates and fiscal years 2022 and 2023 data from USA Spending, by Census-defined metropolitan area, for all metropolitan areas with at least 950,000 residents, excluding New York City (where 31 percent of households do not have car access and transit funding was $102 per capita). Note that some funding for New Haven may be classified as in the New York region due to Metro-North Railroad activities.
Notes: Does not include pandemic-era emergency allocations. Low income = median household income less than $60,000; high income = median household income greater than $75,000.
How We Did It
We compiled fiscal years 2022 and 2023 data on awards and outlays from DOT’s major programs. Our analysis is conducted at the core-based statistical area (CBSA) geographical level, which are metropolitan and micropolitan areas, all comprised of counties. We summed the total funding allocated to counties within each CBSA, excluding data for funding that was distributed outside of CBSAs. We collected demographic and transportation-specific need-based indicators from the US Census Bureau 2016–20 five-year American Community Survey, the 2022 US Census of Governments and the Center for Neighborhood Technology’s 2020 Housing and Transportation Affordability Index. We detail our analysis in greater detail in our methods appendix.
We conducted similar analyses of fiscal years 2022 and 2023 funding for broadband, energy grid, climate resilience, and housing programs. These findings are part of a larger effort to track the distribution of federal infrastructure investments (including housing).