Data on the race and ethnicity of children enrolled in Medicaid/CHIP programs are critical for addressing children’s health care inequities. However, the quality of the race and ethnicity information available in the Transformed Medicaid Statistical Information System (T-MSIS) Analytic Files (TAF)—the newest and most comprehensive source of Medicaid claims and enrollment data—varies considerably across states.
This report examines the quality of race and ethnicity data for Medicaid/CHIP-enrolled children in the 2018 and 2019 TAF. We assess data quality for each state and each of the TAF’s race and ethnicity categories separately.
Why this matters
We provide a practical resource for researchers who are considering using the TAF for analyses on racial and ethnic disparities among children enrolled in Medicaid/CHIP and for key Medicaid/CHIP stakeholders to understand the extent to which the TAF can be used to provide meaningful assessments of racial and ethnic disparities in health care among Medicaid/CHIP-enrolled children.
What we found
Our key findings include the following:
- There is considerable variation in the quality of the TAF’s race and ethnicity variable for children across states and across race and ethnicity categories, and there are few differences in data quality between the 2018 and 2019 TAF.
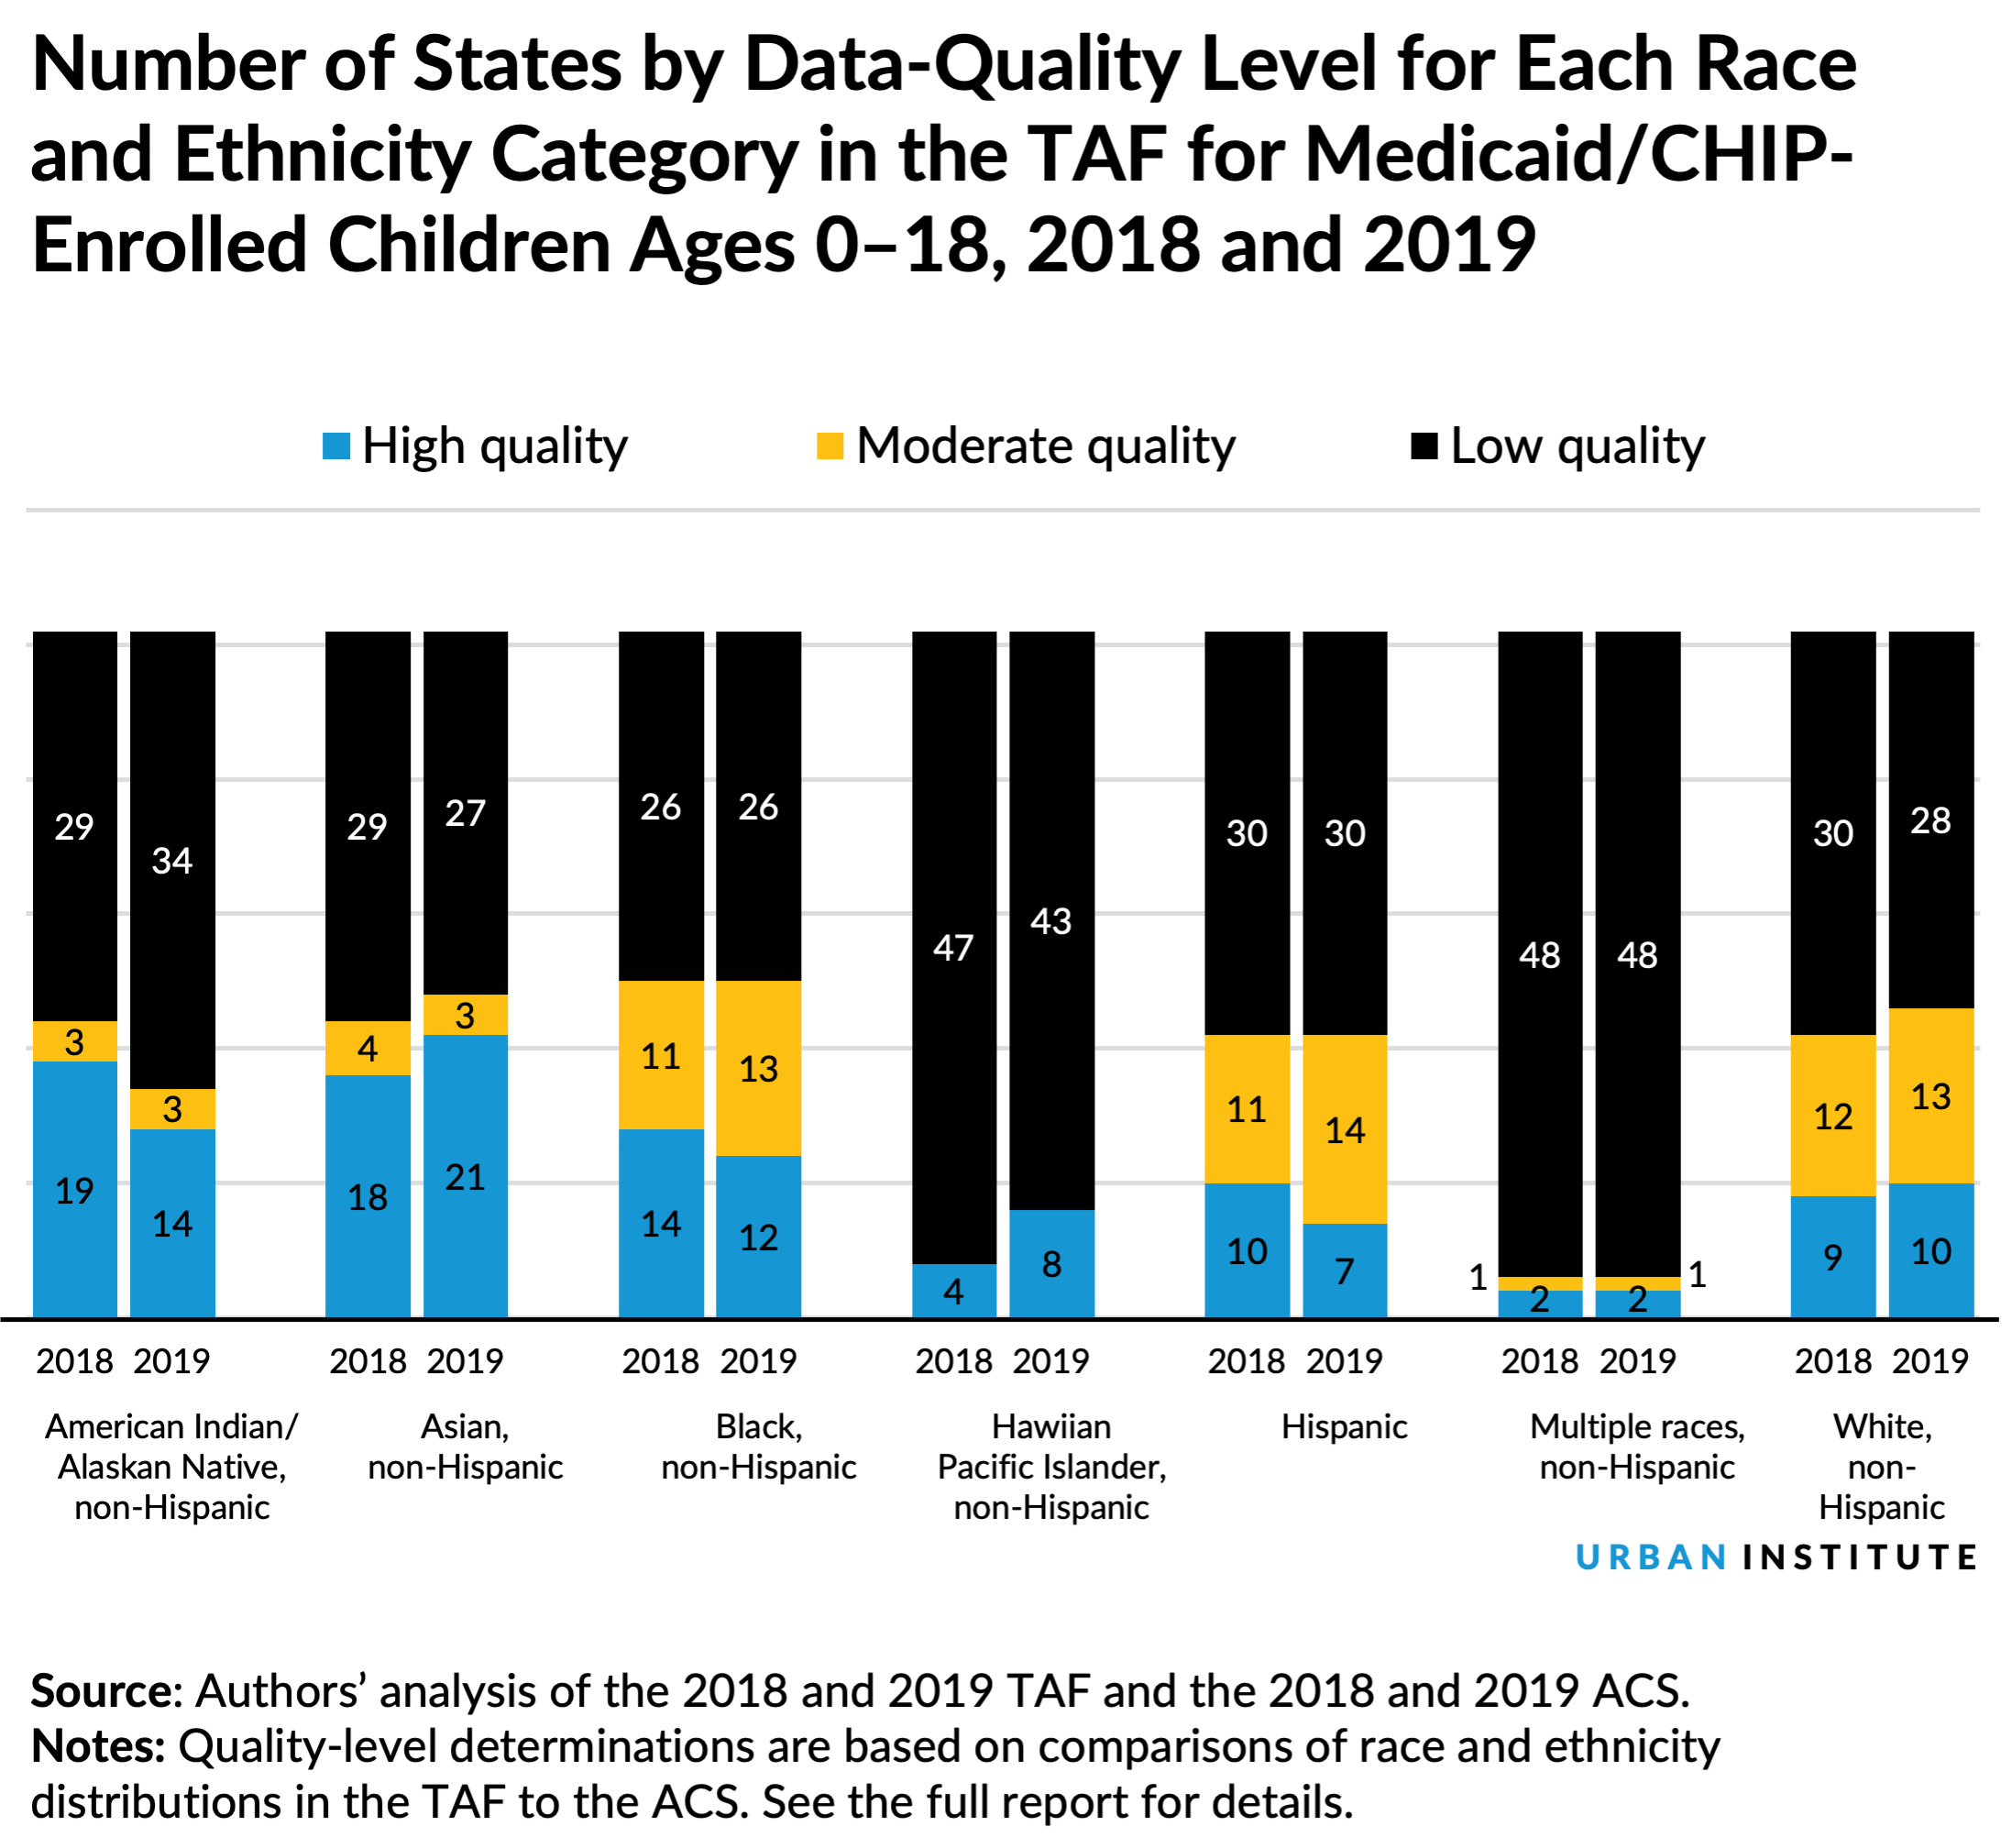
- In the 2018 TAF, approximately 40–50 percent of states have moderate- or high-quality data for identifying children who are American Indian/Alaskan Native (22 states), Asian (22 states), Black (25 states), Hispanic (21 states), and white (21 states). Far fewer states have moderate- or high-quality data for identifying children who are Hawaiian or Pacific Islander (4 states) or multiracial children (3 states). This is reflected in the figure below.
- In the 2018 TAF, only one state (North Carolina) has moderate- or high-quality data for all race and ethnicity categories. Twenty-four states have low quality data for all race and ethnicity categories due to high rates of missing values.
- The rate of missing values for race and ethnicity among children varies substantially across states.
Our findings reinforce the pressing need to improve the quality of race and ethnicity information in the TAF data. However, researchers cannot and should not wait for data quality to improve. Rather, this report and other data-quality resources such as the Centers for Medicare and Medicaid Services’ Data Quality Atlas can be used to identify states where recent TAF data can yield meaningful information on Medicaid/CHIP-covered children’s patterns of service use, quality of care, and enrollment by race and ethnicity—and to stimulate actions in other states to improve race and ethnicity data collection and quality.
How we did it
To assess data quality, we compare state-level distributions of race and ethnicity among children in the TAF to external benchmarks generated from the US Census Bureau’s American Community Survey. Based on this comparison and the rate of missing values, we classify each race and ethnicity category in each state in the TAF as either high quality, moderate quality, or low quality.