Spending on elementary and secondary education includes the operation, maintenance, and construction of public schools plus spending on other educational facilities and programs provided through the school system such as libraries, technical-vocational training, school lunches, guidance counseling, and some adult education. It includes spending on pre-kindergarten programs but not spending on higher education.1
- How much do state and local governments spend on elementary and secondary education?
- How does state spending differ from local spending and what does the federal government contribute?
- How have elementary and secondary education expenditures changed over time?
- How and why does spending differ across states?
How much do state and local governments spend on elementary and secondary education?
In 2021, state and local governments spent $756 billion, or more than one-fifth (21 percent) of direct general spending, on elementary and secondary education.2 As a share of direct state and local general spending, elementary and secondary education was the second-largest expenditure in 2021, only trailing spending on public welfare (which includes Medicaid). Elementary and secondary education spending was the largest state and local expenditure from 1977 to 2014.
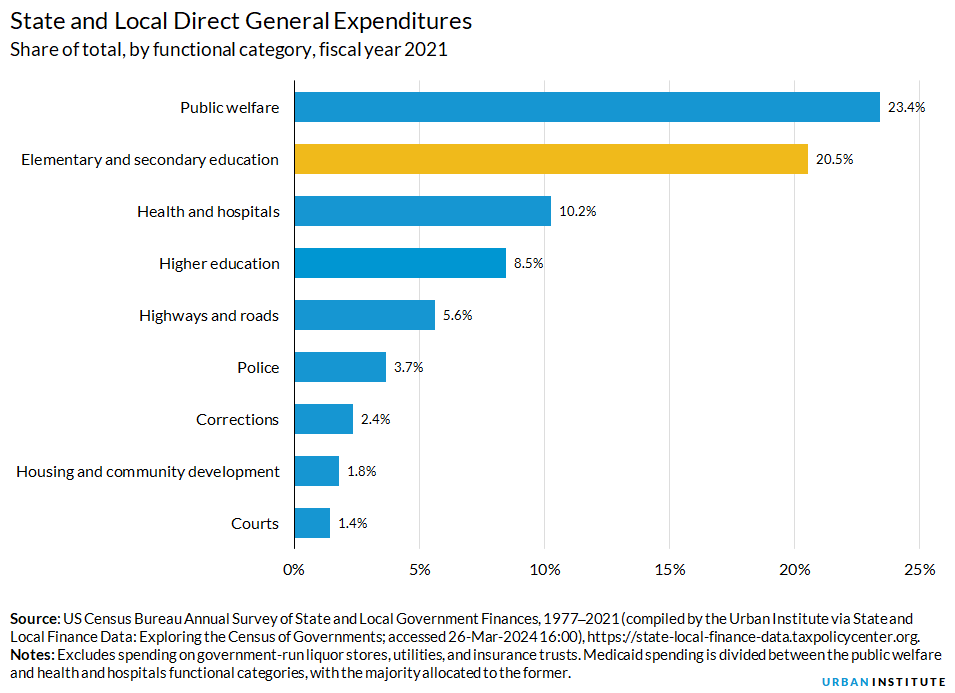
However, if federal transfers are excluded (that is, if only state and local government own-source funds are counted), elementary and secondary education is still the largest expenditure item. The federal government transfers funds to state and local governments for both elementary and secondary education and Medicaid, but it provides nearly two-thirds of Medicaid funds while only contributing a small fraction of public education dollars. (See the section on spending by level of government below for more information.)
Most elementary and secondary education spending goes toward operational costs (89 percent), including salaries and benefits for public school employees engaged in instruction, administration, and guidance counseling, plus spending on textbooks and other auxiliary services such as transportation and lunch programs. The remaining 11 percent is spent on capital outlays, such as school construction and renovation.
How does state spending differ from local spending and what does the federal government contribute?
Direct spending on elementary and secondary education is almost entirely done at the local level. In 2021, 99 percent of all direct spending on elementary and secondary education was done by local governments.
The lopsided direct spending occurs because public education services are typically delivered to students by local school districts (or sometimes counties, municipalities, or townships) and not states.3 In fact, school district spending accounted for 79 percent of all state and local elementary and secondary education in 2017 (the most recent year that we have data for these levels of governments).
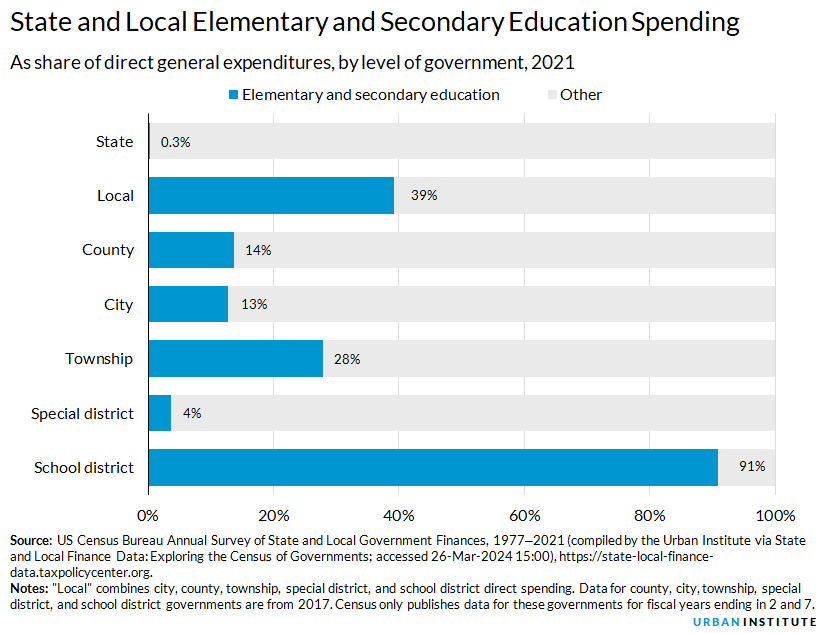
As a result, local governments spend a far larger share of their budgets directly on elementary and secondary education than states. In 2021, 39 percent of local direct general spending went to elementary and secondary education compared with less than 1 percent of state direct spending. Only in Alaska, Hawaii, Kentucky, and New Jersey did state governments deliver more than 5 percent of direct public school spending in 2021. Hawaii is an outlier because the Hawaii State Department of Education operates public schools and thus 100 percent of its direct educational spending occurred at the state level.
Among local levels of government in 2017, elementary and secondary education accounted for 14 percent of county direct spending, 13 percent of city direct spending, and 28 percent of township direct spending (reflecting school spending from dependent districts, where school districts are part of other local governments). Unsurprisingly, elementary and secondary education accounted for nearly all of school district budgets (91 percent). The remainder is largely the result of high school programs that allow students to take community college courses at the school, which is counted as higher education spending.
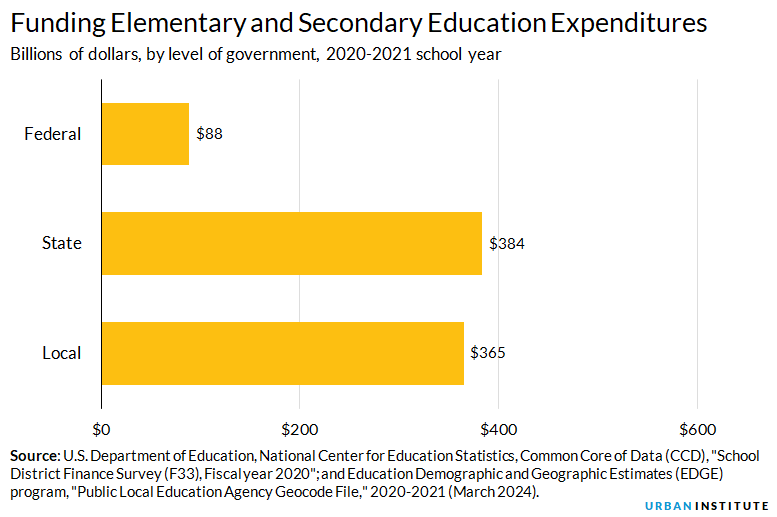
However, while local governments directly spent nearly all of this money, a majority of it was financed through state and federal funds. In 2021, the federal government provided 11 percent of total revenues for elementary and secondary education ($88 billion), states provided 46 percent ($384 billion), and local governments provided 44 percent ($365 billion).4 (Note: These expenditure totals do not sum to the Census expenditure total because this data is from a different source.)
The share of federal spending on public education increased from 8 percent in 2020 because of federal transfers for public education approved by Congress in both the CARES Act and the American Rescue Plan. Thus, the federal share could change again in future years as these pandemic-related funds expire.
More broadly, the share of elementary and secondary education revenues coming from states has increased over time. In 1972, states' share of elementary and secondary education revenues was only 38 percent, but it grew to 49 percent by 1987.5 This increase was related to court decisions, or the threat of lawsuits, beginning with the California Supreme Court’s 1972 Serrano v. Priest decision, which mandated states increase equity and adequacy in their education finance systems.
How have elementary and secondary education expenditures changed over time?
From 1977 to 2021 (in 2021 inflation-adjusted dollars), state and local government spending on elementary and secondary education increased from $320 billion to $756 billion, a 136 percent increase. That was lower than the spending growth in public welfare, health and hospitals, higher education, and police expenditures over the same period. However, when measured in dollars, the real spending increase for elementary and secondary education ($436 billion) between 1977 and 2021 trailed only public welfare ($708 billion). Much of the increase in public welfare spending was driven by federal spending increases on Medicaid. (For more information on spending growth, see our state and local expenditures page.)
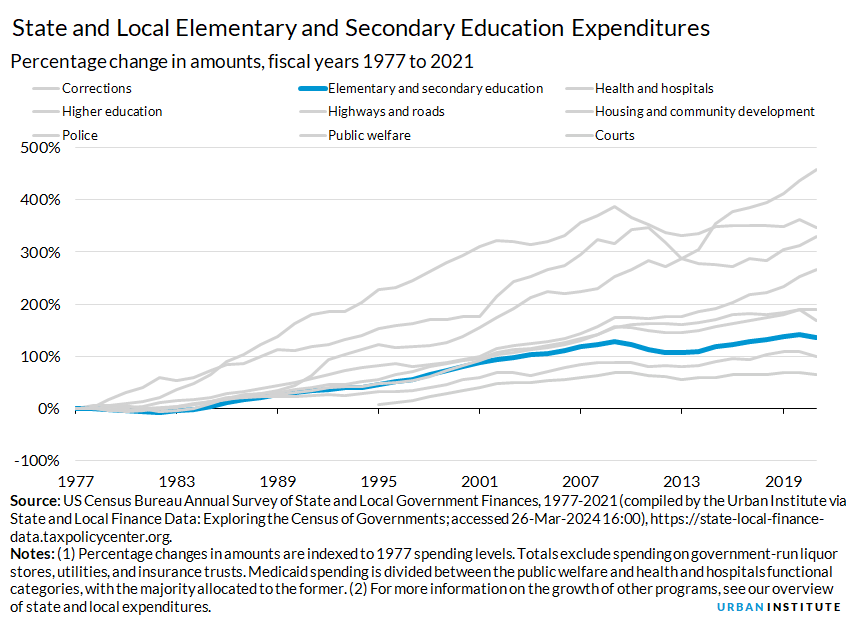
As a share of state and local direct general expenditures, elementary and secondary education has fallen from 26 percent in 1977 to 21 percent in 2021. Again, this change is not the result of lower state and local spending on elementary and secondary education over the period, but rather faster growth in public welfare spending (driven in part by federal funding increases), which grew from 13 percent to 23 percent over this period.
How and why does spending differ across states?
Differences in per capita and per pupil spending highlight important variation in spending on elementary and secondary education across states. Nationally, state and local governments spent $2,277 per capita on elementary and secondary education in 2021. At $4,952, the District of Columbia spent the most per capita.6 Among the states, New York ($3,817), Alaska ($3,448), Wyoming ($3,193), New Jersey ($2,956), and Vermont ($2,944) spent the most per capita on elementary and secondary education. State and local per capita spending on elementary and secondary education was lowest in Arizona ($1,381), Idaho ($1,404), Florida ($1,503), and Tennessee ($1,551).
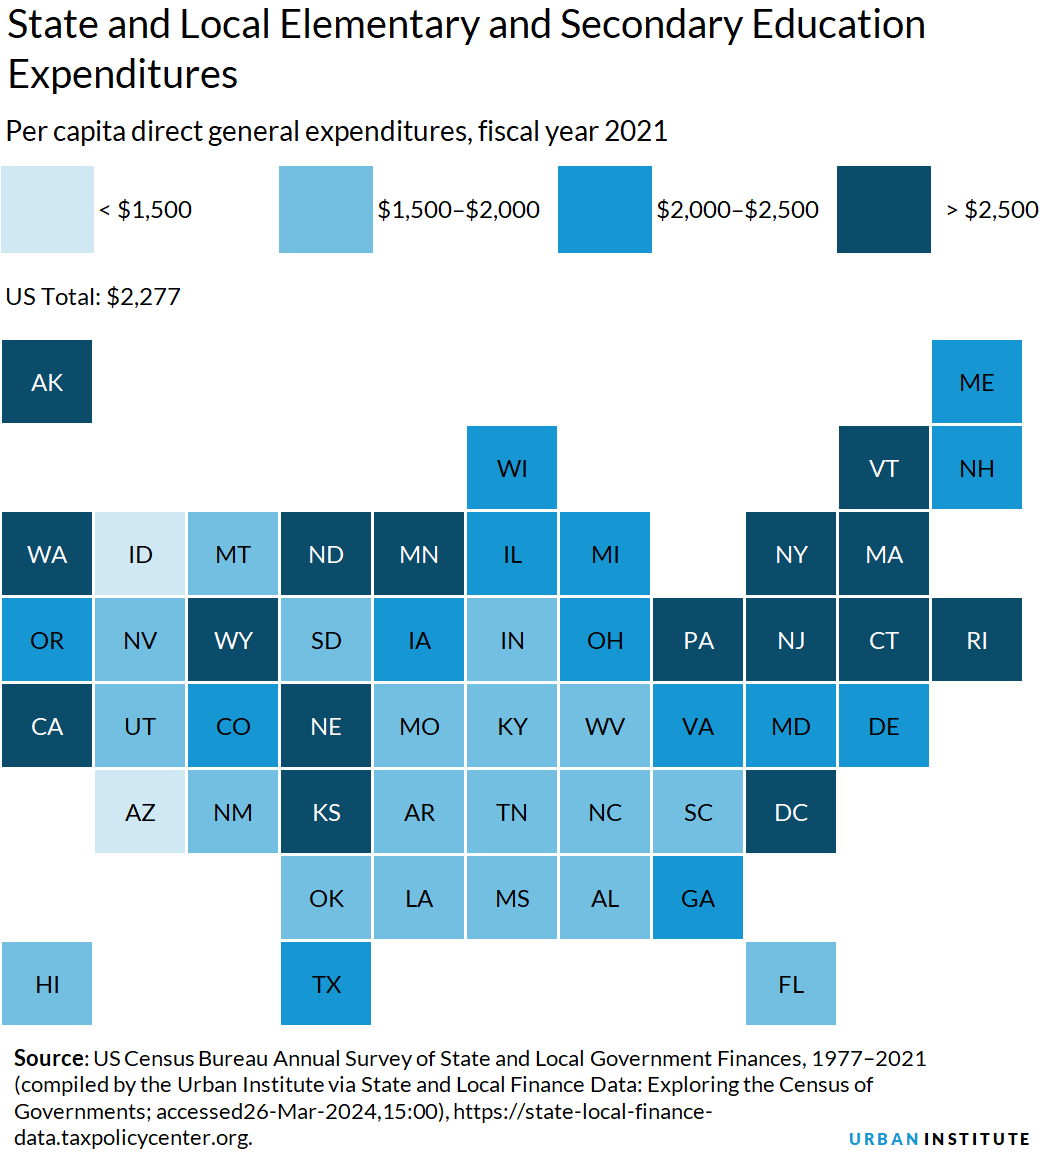
Data: View and download each state's per capita spending by spending category
Per capita spending is an incomplete metric because it doesn’t provide any information about a state's demographics, policy decisions, administrative procedures, or residents’ choices.
States whose governments spend the most per capita on elementary and secondary education tend to have higher labor costs or employ more teachers per student, but they are not necessarily home to the most students. New York, for example, has relatively few school-age children as a share of its total population, but the state has more teachers and staff per student than nearly any other state. New York also pays its teachers more, resulting in higher spending despite relatively fewer kids.7
In contrast, some states that spend the least per capita on elementary and secondary education have relatively high enrollment in public schools. For example, a large percentage of Arizona’s population is school-age children, and many of them are in public schools, but the state has fewer teachers per pupil and lower salaries than other states, translating to low per capita spending. In contrast, Hawaii has relatively few school-age children and low per capita spending but not relatively low per pupil spending because it has more teachers and higher pay than many states.
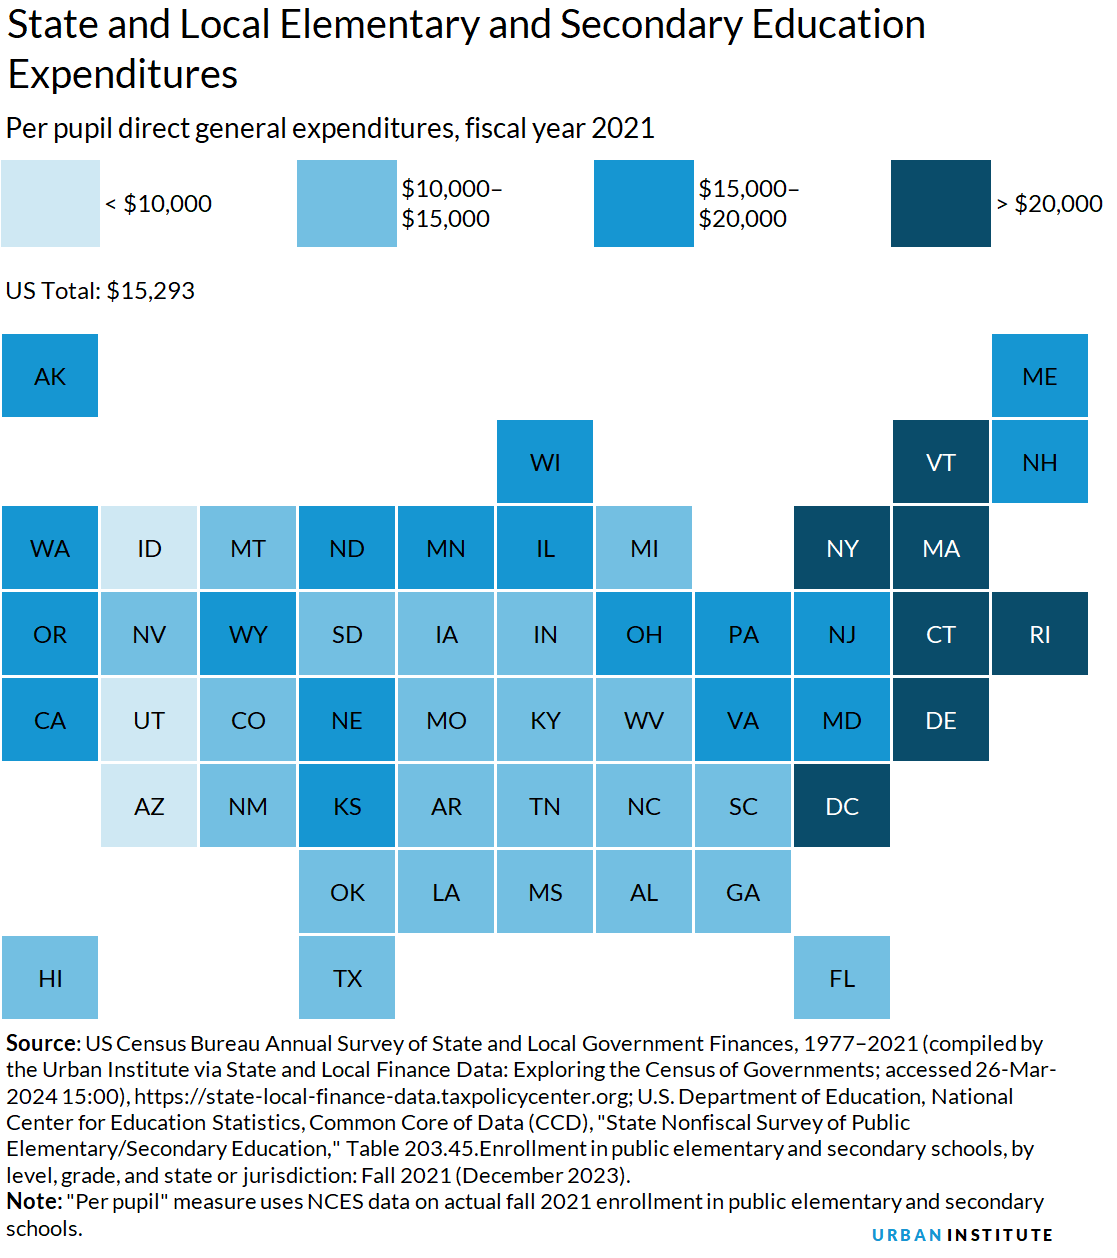
Thus, per pupil spending can provide a more nuanced picture because it reflects spending on students that are enrolled in the public educational system. However, it still does not provide complete information about policy decisions, class sizes, or labor costs.
Overall, the United States spent $15,293 per pupil in 2021.8 Among the states, New York spent the most per pupil ($29,743), followed by Delaware ($25,996), and Vermont ($22,681). The District of Columbia’s per pupil spending was $23,668. These states also generally had the most spending per capita in 2021. Per pupil spending was lowest in the following states: Idaho ($8,508), Arizona ($8,853), Utah ($9,278), and Oklahoma ($10,055).
Interactive Data Tools
State and Local Finance Data: Exploring the Census of Governments
Which states prioritize equity in school renovation funding??
Which students receive a greater share of school funding?
How do school funding formulas work?
How has education funding changed over time?
School funding: Do poor kids get their fair share?
What everyone should know about their state’s budget
Further Reading
How COVID-19-Induced Changes to K-12 Enrollment and Poverty Might Affect School Funding
Kristin Blagg, Emily Gutierrez, and Victoria Lee (2021)
Making Sense of State School Funding Policy
Matthew Chingos and Kristin Blagg (2017)
Assessing Fiscal Capacities of States: A Representative Revenue System–Representative Expenditure System Approach, Fiscal Year 2012
Tracy Gordon, Richard Auxier, and John Iselin (2016)
Notes
1 Data are from the census expenditure functions E12, F12, G12, and K12.
2 Direct general spending refers to all direct spending (or spending excluding transfers to other governments) except spending specially enumerated as utility, liquor store, employee-retirement, or insurance trust. Unless otherwise noted, all data are from the US Bureau of the Census, Survey of State and Local Government Finance, 1977–2021, accessed via the Urban-Brookings Tax Policy Center State and Local Finance Data, March 26, 2024, https://state-local-finance-data.taxpolicycenter.org/. The census recognizes five types of local government in addition to state government: counties, municipalities, townships, special districts (e.g., a water and sewer authority), and school districts. All dates in sections about expenditures reference the fiscal year unless explicitly stated otherwise.
3 School districts can function as independent government entities or as fiscally dependent agencies of their parent government. For example, New York State is home to a mix of independent and city-dependent school districts. The five largest cities in New York all manage a fiscally dependent school system. New York City, for example, manages a dependent school system under its Department of Education.
4 "Revenues and Expenditures for Public Elementary and Secondary Education: FY 21," National Center for Education Statistics, August 2023. https://nces.ed.gov/programs/digest/d23/tables/dt23_235.10.asp.
5 See Sheila E. Murray, Kim Rueben, and Carol Rosenberg, “State Education Spending: Current Pressures and Future Trends,” National Tax Journal vol. LX no. 2, 325–345. The authors use data from the National Center for Education Statistics.
6 The District of Columbia is often an outlier because, although it functions as a state and a locality, it most closely resembles a central city in terms of its population and economic activity, much of which comes from nonresidents. Its ranking among states should be interpreted within this context.
7 For an analysis of components of state and local spending using 2012 data, see the Urban Institute’s interactive tool, “What everyone should know about their state’s budget”.
8 The Urban Institute. Data from U.S. Census Bureau, Annual Survey of State and Local Government Finances, Government Finances, Volume 4, and Census of Governments. Date of Access; US Department of Education, National Center for Education Statistics, Digest of Education Statistics 2023, Table 203.20, Fall 2022. https://nces.ed.gov/programs/digest/d23/tables/dt23_203.20.asp. https://nces.ed.gov/programs/digest/d23/tables/dt23_203.20.asp