State and Local Backgrounders Homepage
Spending on highways and roads includes the operation, maintenance, and construction of highways, streets, roads, sidewalks, bridges, and other related structures.1 This category includes both regular highways and toll highways.
- How much do state and local governments spend on highways and roads?
- How does state spending differ from local spending and what does the federal government contribute?
- How have highway and road expenditures changed over time?
- How and why does spending differ across states?
How much do state and local governments spend on highways and roads?
In 2020, state and local governments spent $204 billion, or 6 percent of direct general spending, on highways and roads.2 As a share of state and local direct general expenditures, highways and roads were the fifth-largest expenditure in 2020.

In 2020, 43 percent of highway and road spending went toward operational costs, such as maintenance, repair, snow and ice removal, highway and traffic design and operation, and highway safety. The other 57 percent went toward capital spending, such as the construction of both highways and roads.
This operational-capital divide stands in stark contrast to other major state and local spending categories, where capital spending typically accounts for 10 percent or less of total direct spending. Since 1977, capital spending has consistently been between 50 percent and 60 percent of state and local highway and road spending.
How does state spending differ from local spending and what does the federal government contribute?
Spending on highways and roads is roughly split between state and local governments. In 2020, states provided 60 percent of highway and road spending while local governments provided 40 percent. State spending is typically for highways and tollways, whereas local governments spend more money on local streets and roads.
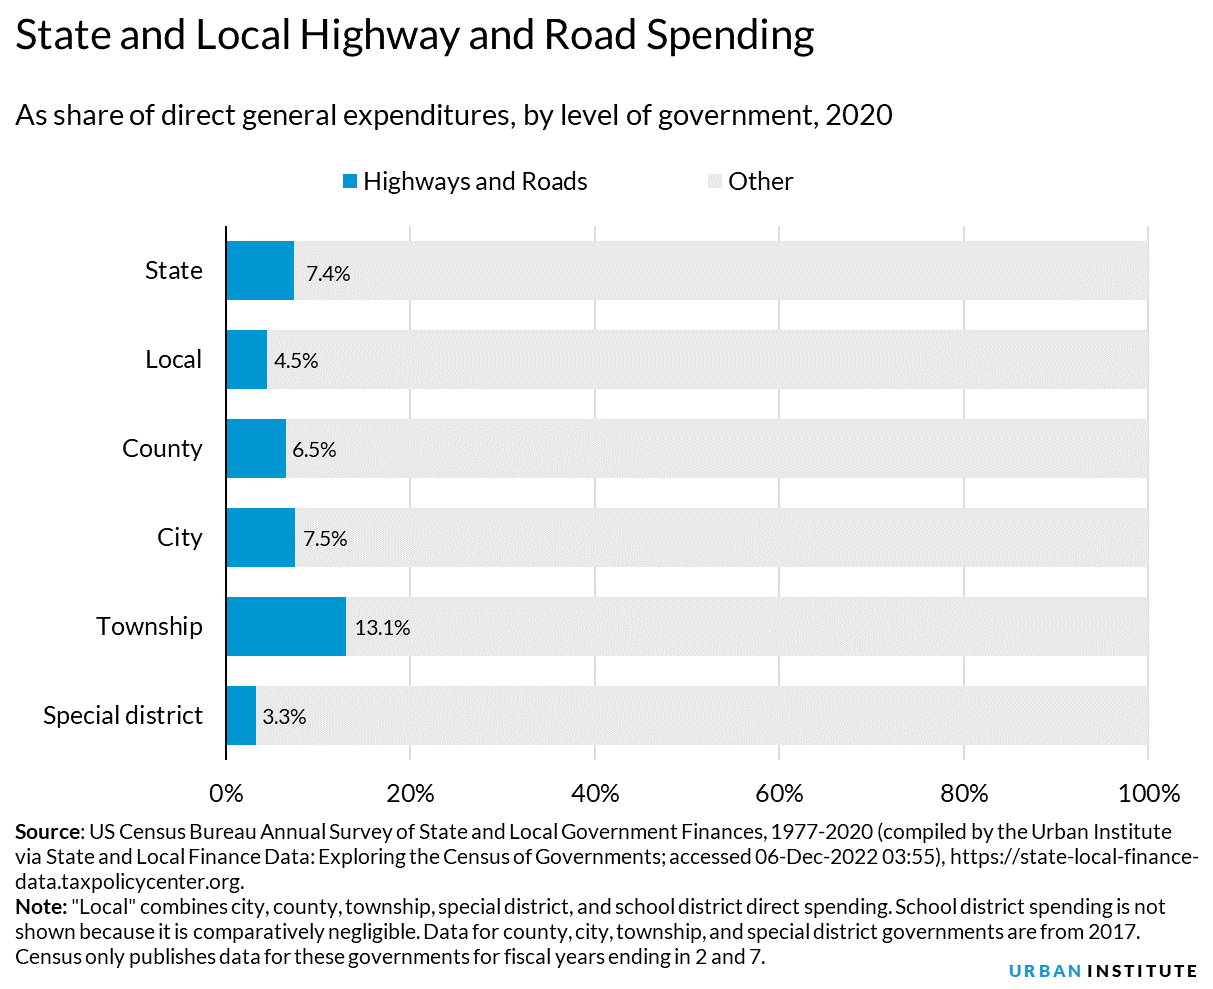
Direct spending on highways and roads as a share of total spending in 2020 was 7 percent for state governments and 4.5 percent for local governments. In 2017 (the most recent year that we have data for these levels of government), direct spending on highways and roads accounted for 6.5 percent of county spending, 7.5 percent of city spending, 13 percent of township spending, and 3 percent of special district spending.
 Both state and local governments dedicate motor fuel tax revenue and highway toll revenue to transportation spending. However, revenue from motor fuel taxes and tolls (even combined) do not contribute a majority of the funds used for highway and road spending. In 2020, state and local motor fuel tax revenue ($53 billion) accounted for 26 percent of highway and road spending, while toll facilities and other street construction and repair fees ($22 billion) provided another 11 percent. The majority of funding for highway and road spending came from state and local general funds and federal funds.
In 2020, state and local governments provided three-quarters of highway and road funding ($154 billion) and federal transfers accounted for $51 billion dollars (25 percent). These numbers and percentages will change in future years when state and local governments begin spending the $110 billion for roads, bridges, and other major transportation projects included in the Federal Infrastructure Bill passed in November 2021.

How have highway and road expenditures changed over time?
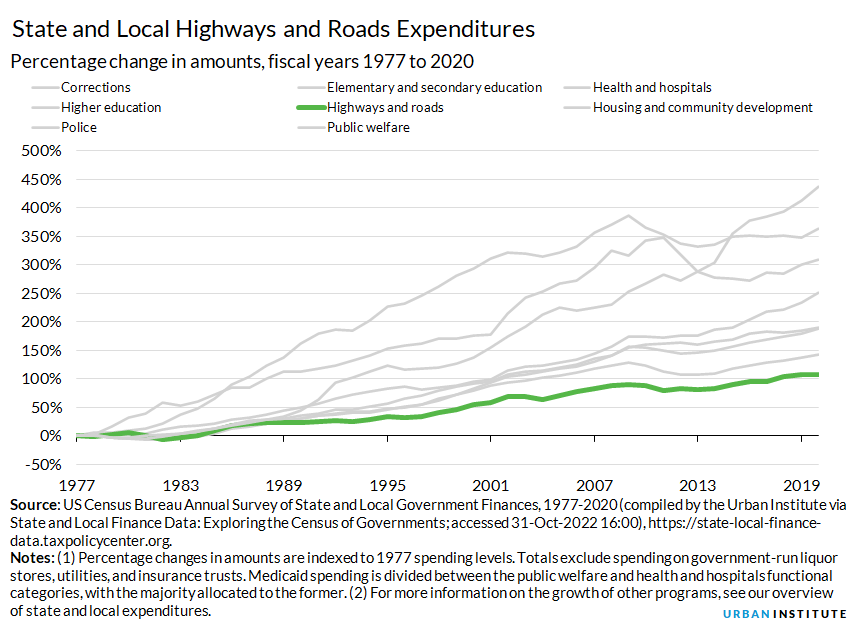
From 1977 to 2020, in 2020 inflation-adjusted dollars, state and local government spending on highways and roads increased from $98 billion to $204 billion (107 percent increase). Among major spending programs, this was the lowest level of state and local spending growth over the period. The next-lowest spending growth was for elementary and secondary education (143 percent). (For more information on spending growth see our state and local expenditures page.)

The share of state and local spending going to highways and roads also fell over the period, dropping from 8 percent in 1977 to 6 percent in 2020.
How and why does spending differ across states?
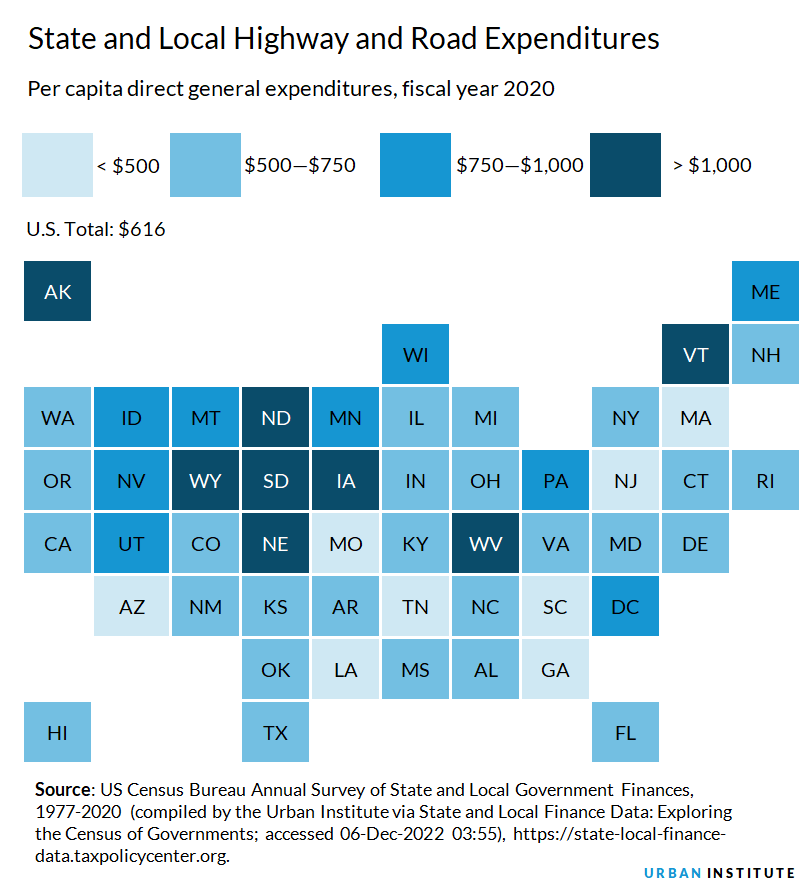
Across the US, state and local governments spent $616 per capita on highways and roads in 2020. Alaska spent the most per capita on highways and roads at $1,858 per person, followed by North Dakota ($1,549), Wyoming and South Dakota (both $1,366), and Vermont ($1,082). Arizona spent the least on highways and roads at $425 per person, followed by Tennessee ($427), Missouri ($449), South Carolina ($462), and Louisiana ($469).

Data: View and download each state's per capita spending by spending category
Per capita spending is an incomplete metric because it doesn’t provide any information about a state’s demographics, policy decisions, or physical size. A state’s total spending on highways and roads depends on several factors, including how many drivers are on the road, how many lane miles are in a state, and the usage of public roadways in the state as well as payroll, materials, and other costs. States with high per capita spending come from two general groups: low-population states with low population density but large physical size (e.g., Alaska, North Dakota, and Wyoming) and places with higher traffic volume, which produces higher costs.3
Further, because highways and roads are capital intensive, spending can change dramatically from year to year depending on whether a capital project is active in that state. For example, Delaware's real per capita spending shifted from $893 in 2010 to $541 in 2015 to $730 in 2020. Similarly, Wisconsin's real per capita spending bounced from $704 in 2016 to $1,013 in 2017 to $813 in 2020.
Spending per vehicle mile traveled may provide a sense of how much states spend relative to how much their highways and roads are used. Looking at state and local dollars spent as a share of vehicle miles traveled, the US average was $703 for every 10,000 miles traveled in 2020.4 The highest per vehicle mile traveled spender was Alaska ($2,565), followed by the District of Columbia ($2,181), North Dakota ($1,376), Pennsylvania ($1,256), and South Dakota ($1,244). Spending per vehicle mile traveled spending was lowest in Missouri ($379), Tennessee ($387), Alabama ($388), and Georgia ($436).
Interactive Data Tools
State and Local Finance Data: Exploring the Census of Governments
What everyone should know about their state’s budget
Further Reading
Understanding How Infrastructure Bill Dollars Affect Your Community
Nikhita Airi (2022)
Using Dollars with Sense: Ideas for Better Infrastructure Choices
Urban Institute (2019)
Infrastructure, the Gas Tax, and Municipal Bonds
Richard Auxier and John Iselin (2017)
High costs may explain crumbling support for US infrastructure
Tracy Gordon, Urban Wire (2015)
Reforming State Gas Taxes
Richard Auxier (2014)
Assessing Fiscal Capacities of States: A Representative Revenue System–Representative Expenditure System Approach, Fiscal Year 2012
Tracy Gordon, Richard Auxier, and John Iselin (2016)
Notes
1 Data are from Census expenditure functions E44, F44, G44, E45, F45, and G45.
2 Direct general spending refers to all direct spending (or spending excluding transfers to other governments) except spending specially enumerated as utility, liquor store, employee-retirement, or insurance trust. The utility sector includes public transit systems. Unless otherwise noted, all data are from US Census Bureau Annual Survey of State and Local Government Finances, 1977-2020 (compiled by the Urban Institute via State and Local Finance Data: Exploring the Census of Governments; accessed December 6, 2022, https://state-local-finance-data.taxpolicycenter.org. The census recognizes five types of local government in addition to state government: counties, municipalities, townships, special districts (e.g., a water and sewer authority), and school districts. All dates in sections about expenditures reference the fiscal year unless explicitly stated otherwise.
3 For an analysis of components of state and local spending using 2012 data, see the Urban Institute’s interactive tool, What everyone should know about their state’s budget.
4 Calculation from the US Bureau of the Census, Survey of State and Local Government Finance, 1977–2020, accessed via the Urban-Brookings Tax Policy Center Data Query System, December 6, 2022, https://state-local-finance-data.taxpolicycenter.org; and US Department of Transportation, Federal Highway Administration, Highway Statistics 2017 Table 5.4.1: Vehicle-miles of travel, by functional system. https://www.fhwa.dot.gov/policyinformation/statistics/2020/vm2.cfm.