
Capital is vital for communities. Businesses depend on it to expand. Families need it to be safely and stably housed. Consumers need it to find affordable groceries. And cities need it to pave streets and update sewers.
But how well are federal community development finance flows targeted to areas that need them? Relatively little is known about community development investment trends at the local level. Our new Community Development Financial Flows data tool shows which counties are doing better at accessing federal funds and which are facing serious shortfalls.
We measured federally sponsored or incentivized community development capital to all US counties with populations greater than 50,000 (which accounts for 88 percent of the US population) using data from 2011 to 2015. We tracked funding in four dimensions—housing, small business, impact finance, and other community development—and created a combined measure that averages those four categories.
We scaled each dimension by a per capita denominator (either the number of people who earn below 200 percent of the federal poverty level or the number of people working in small businesses). This allowed us to avoid mapping only population trends.
No single measure is perfect or the final story. Our data include only federally connected funds (not state, local, or philanthropic funds), and though we include many important programs, we lack information about the full set of federal community development financing.
Despite these limitations, the investment flows we track are vital for communities, and understanding their implications is important for local leaders looking to draw more resources.
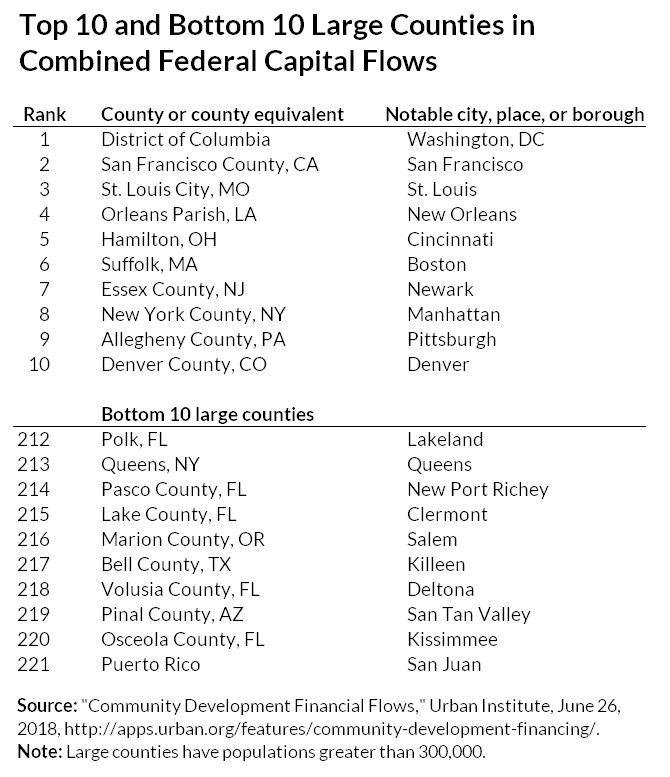
Top- and bottom-ranking counties
The top- and bottom-ranking counties convey where community development resources are and are not flowing—those directly controlled by the federal government and those where private actors leverage public resources. This table ranks the top 10 and bottom 10 large counties in terms of combined federal capital flows. Full rankings for the four dimensions and for midsize and small counties can be found in the data tool.
Comparing counties with high and low capital flows
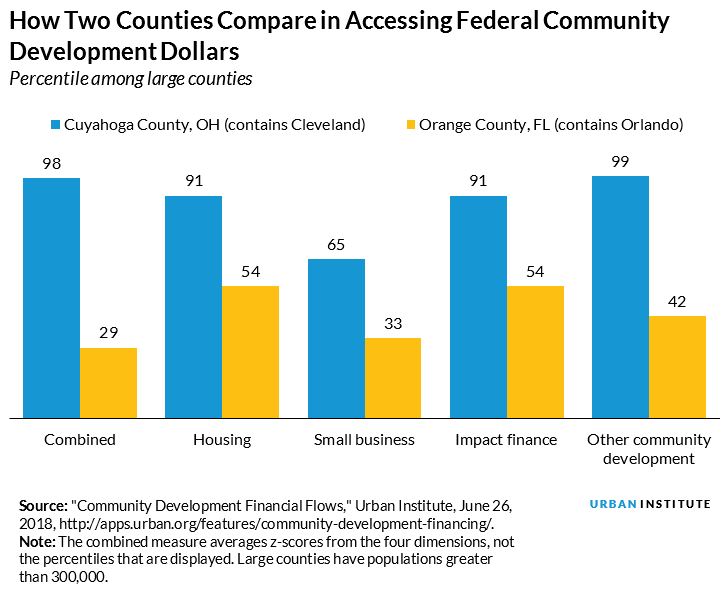
This data tool can be used to compare counties along the relevant dimensions—for example, looking at counties that access high versus low capital flows. Cuyahoga County, Ohio, has a long tradition of community development corporations and local government attention to community development. The county also does well in formula-driven allocations, such as under the Community Development Block Grant.
The county, which contains Cleveland, stands near the top in terms of accessing federal community development dollars. Specifically, the county does well in accessing housing, impact finance, and other community development capital. It is weaker in small-business finance, though not by enough to pull down the combined measure.
In contrast, Orange County, Florida (which contains Orlando), is among the lowest-ranked counties with more than 1 million people and is in the 29th percentile of all counties in our analysis. Orange County is just above the 50th percentile on housing and impact finance, but it does worse on other community development and especially on small-business finance.
What does your county’s rank suggest about local capacity?
Are county ranks in community development actionable? The locus of control sits with several actors depending on the program or incentive. Some funding flows are more readily changeable than others, but collectively, local officials—in partnership with others—can make area improvements. The information in this data tool can spark local dialogue and inform strategy design.
To that end, we offer several questions to guide discussion and reflection as you use this tool.
- How does your county rank overall and by component? How does this compare with your prior understanding?
- How does your county compare with neighboring or similarly situated counties?
- For dimensions where you identify deficits, which governmental and nongovernmental actors have control or influence about these capital flows?
- How sophisticated are local nongovernmental actors, and what is their track record in attracting capital from federal and other competitive sources?
- How robustly are your state, county, and major cities engaged in cultivating, partnering, seeding, and providing incentives for private-market provision of community development capital? Does the county get its fair share of state resources?
Tune in and subscribe today.
The Urban Institute podcast, Evidence in Action, inspires changemakers to lead with evidence and act with equity. Cohosted by Urban President Sarah Rosen Wartell and Executive Vice President Kimberlyn Leary, every episode features in-depth discussions with experts and leaders on topics ranging from how to advance equity, to designing innovative solutions that achieve community impact, to what it means to practice evidence-based leadership.