
The Office of the Comptroller of the Currency recently issued an advance notice of proposed rulemaking asking stakeholders to engage in modernizing the Community Reinvestment Act (CRA), so we’re taking the opportunity to understand how banks have been meeting their CRA lending responsibilities.
Our recent research offered many insights and revealed several surprises. For example, in a previous blog post, we showed small business lending and community development lending play an enormous role in helping most banks fulfill their CRA requirements.
In this post, we show that while multifamily lending is much smaller than single-family lending, it has an outsize effect both in meeting the needs of low- and moderate-income (LMI) communities and in helping banks meet their CRA requirements.
In fact, multifamily lending constitutes only 7 percent of total residential lending volume, compared with 93 percent for single-family lending, but multifamily lending composes 23 percent of the total CRA-qualified mortgage lending.
Why are multifamily loans disproportionately important for CRA lending?
Multifamily properties are concentrated in LMI communities. Table 1 shows that 36 percent of national multifamily lending is to LMI communities, and 20 percent of single-family lending is to LMI communities or LMI borrowers.
This trend would be true with or without the CRA. However, two other factors suggest that the CRA is a larger factor in the multifamily world.
- Banks do considerably more LMI multifamily lending and less single-family lending than nonbanks.
- A greater share of banks’ multifamily LMI loans are within their CRA assessment areas than is the case for single-family loans.
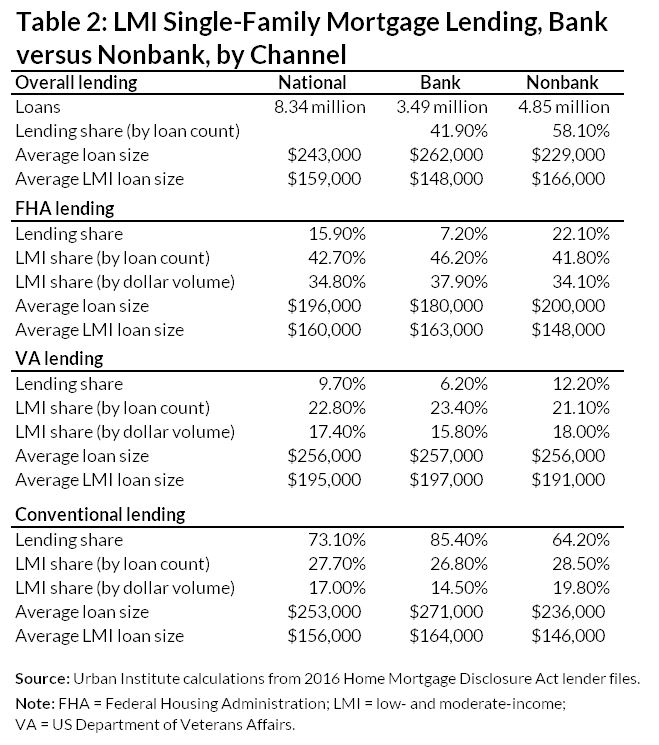
The second point is best seen by comparing the lending patterns of banks, which are subject to the CRA, with the lending patterns of nonbanks, such as independent mortgage banks and credit unions, which are not subject to the CRA. This comparison reveals that banks do more multifamily lending in the US than nonbanks (86 versus 14 percent by loan count and 73 versus 45 percent by dollar volume), while banks do less single-family lending (42 versus 58 percent by loan count and 45 versus 55 percent by dollar volume).
Moreover, in multifamily lending, banks do more LMI lending (47 percent by loan count) than the nonbanks (39 percent), but banks do less LMI lending for single-family than their nonbank counterparts (28 versus 31 percent).

Why should banks do less LMI single-family lending than nonbanks?
At first glance, it seems counterintuitive that banks subject to the CRA would do less single-family LMI lending than their nonbank counterparts. But this can be mostly explained by the banks’ reluctance to make Federal Housing Administration (FHA) loans. Currently, banks do much less FHA lending than nonbanks (for many reasons), and the FHA tends to have a greater LMI concentration.
In 2016, 7 percent of single-family lending by banks was FHA-insured, and 85 percent was conventional, compared with a 22 percent FHA-insured rate and a 64 percent conventional lending rate for nonbanks. (The balance is US Department of Veterans Affairs, or VA, mortgages.) Looking at just FHA loans, the LMI share is comparable between banks and nonbanks with 46 percent of total FHA bank lending by loan count for LMI and 42 percent for nonbanks.
However, the FHA LMI share for both banks and nonbanks is higher than in other channels. Just 21 to 23 percent of VA lending and 27 to 28 percent of conventional lending qualifies as LMI.
After compensating for the single-family lending mix, there is very little difference in LMI lending between banks and nonbanks. By contrast, in multifamily lending, banks have a much greater LMI focus than their nonbank counterparts.
Multifamily lending has a bigger role than the more plentiful single-family lending in helping banks meet their CRA assessment area responsibilities
For CRA purposes, the lending that counts is LMI lending inside a bank’s assessment areas (areas surrounding all bank branches). Using Home Mortgage Disclosure Act data matched with the Federal Financial Institutions Examination Council’s loan files to identify assessment areas, we find that within assessment areas, banks make 49 percent of their multifamily loans by count to LMI tracts, which is substantially higher than the 43 percent of multifamily loans made outside of assessment areas. For single-family lending, there is no difference in the LMI share inside and outside assessment areas.
The amount of lending done inside and outside assessment areas varies by lending type— multifamily or single-family—and by bank size. We divide the banks into four categories by asset size: over $100 billion, $10 to $100 billion, $3 to $10 billion, and under $3 billion. Table 3 shows our results for both single-family and multifamily lending. In both cases, the largest banks do a significant amount of the lending by dollar volume—66 percent of single-family loans and 62 percent of multifamily loans.
The difference between multifamily and single-family lending inside of assessment areas can be explained by the behavior of the two largest bank categories. The largest banks do 92 percent of their multifamily lending within their assessment areas versus 83 percent of their single-family lending. The $10 to $100 billion banks do 73 percent of their multifamily lending within assessment areas versus 53 percent of their single-family lending. Lending inside assessment areas is similar for the two smallest bank categories: 50 to 60 percent for both multifamily and single-family lending.
Larger banks make larger multifamily loans than smaller banks. For single-family lending, loan sizes are consistent across all sizes of banks. Larger banks’ assessment areas are more geographically extensive than smaller banks, so more of their lending will be in assessment areas.

While both banks and nonbanks do more single-family than multifamily lending, multifamily loans play an outsize role in serving LMI populations and meeting CRA responsibilities within their assessment areas.
A quick look at our methodology
For single-family loans, LMI lending is defined as lending to borrowers who earn less than 80 percent of the area median income or lending in a census tract where the median income is less than 80 percent of the area medium income (LMI tract). For multifamily loans, LMI lending is defined as lending in LMI census tracts.
We counted all multifamily loans in LMI tracts as LMI lending, and all LMI tracts within a bank’s assessment area as CRA-eligible, since there were no data on rent levels or renter income. (This was a necessary oversimplification. In reality, not all multifamily loans in assessment areas will be given CRA credit. Examiners are unlikely to give CRA credit to loans on high-end properties with no affordable units in gentrifying areas. Moreover, multifamily loans within a bank’s assessment area, but not in an LMI tract, may qualify if they likely serve LMI renters.)
Tune in and subscribe today.
The Urban Institute podcast, Evidence in Action, inspires changemakers to lead with evidence and act with equity. Cohosted by Urban President Sarah Rosen Wartell and Executive Vice President Kimberlyn Leary, every episode features in-depth discussions with experts and leaders on topics ranging from how to advance equity, to designing innovative solutions that achieve community impact, to what it means to practice evidence-based leadership.