In the QRM reproposal released on August 22, the six agencies involved in the mortgage backed securities (MBS) portion of the rule[1] proposed that the definition of Qualified Residential Mortgage (QRM) be equal to the definition of Qualified Mortgage (QM). Loans that are QRM eligible will not be subject to the risk retention requirements of Dodd-Frank, which are the subject of the same rulemaking. This is the least restrictive definition possible, as Dodd Frank requires that the definition of QRM be no broader than the definition of QM, an ability to pay measure.[2]
The agencies also asked for comment on a much more restrictive alternative definition of QRM (Alternative QRM, also referred to as QRM Plus). They stated they were putting forth the alternative because they were concerned that “the effect of aligning QRM with QM could ultimately decrease credit availability as lenders, and consequently securitizers, would be very reluctant to transact in non-QM loans.”
From the commentary included in the proposal, it is clear there was considerable debate as to what default experience should be tolerated on loans that are considered QRM. For example, the agencies state:
Consistent with these statistical models, historical data indicate that mortgages that meet the QM criteria have a lower probability of default than mortgages that do not meet the criteria. This pattern is most pronounced for loans originated near the peak of the housing bubble, when non-traditional mortgage products and lax underwriting proliferated. For example, of loans originated from 2005 to 2008, 23 percent of those that met the QM criteria experienced a spell of 90-day or more delinquency or a foreclosure by the end of 2012, compared with 44 percent of loans that did not meet the QM criteria. In citing these statistics, the agencies are not implying that they consider a 23 percent default rate to be an acceptable level of risk.
They then go on to mention that the high default rate was caused by an “extraordinary macroeconomic environment” and is not typical of what can be expected going forward. Moreover, the agencies were “concerned about the prospect of imposing further constraints on mortgage credit availability at this time, especially as such constraints might disproportionately affect groups that have historically been disadvantaged in the mortgage market, such as lower-income, minority, or first-time homebuyers.”
In this article, we take a close look at the default experience of mortgages originated in 2012 and earlier. We make two central points:
- It is critically important how you define default. In particular, in an analysis of the performance of loans said to meet the QM criteria,[3] the SEC used 90+ days delinquent as their definition of default. Not surprisingly, if instead the standard is 180 days delinquent, the number of defaults goes down. And if the definition of “default” is loan termination, the number of defaulted loans declines even more. Moreover the default rates are very different for different periods. For the 2005 and earlier period, the default rates on QRM=QM mortgages are well within acceptable limits.
- The Alternative definition of QRM has very low default rates; however, we argue this is in part because so few loans qualify. (Our earlier post, QRM v. Alternative QRM: Quantifying the Comparison, analyzes how many loans qualify under both QRM=QM and the Alternative.)
We support these arguments using several databases. We begin our analysis with the CoreLogic Securitized Databases (MBS and ABS), then move on to discuss GSE loans and loans in bank portfolios using the CoreLogic Prime Servicing database. We include portfolio loans, as these loans could be securitized if the bank lender chose to do so. We did not include an analysis of FHA/VA loans, as these loans are exempt from the QRM rules.
Default rates from the CoreLogic Securitized Databases
Using data from the CoreLogic Securitized Databases, table 1 shows the portion of loans in private label securities (PLS) that went 90+ days delinquent: 15.9 percent for the 2005 and earlier period, 53.3 percent for the 2006-2008 period, and a very modest 0.3 percent for 2009 and later. Since under the current proposal QRM=QM, the table shows the default rates of QM borrowers[4] versus non-QM borrowers.
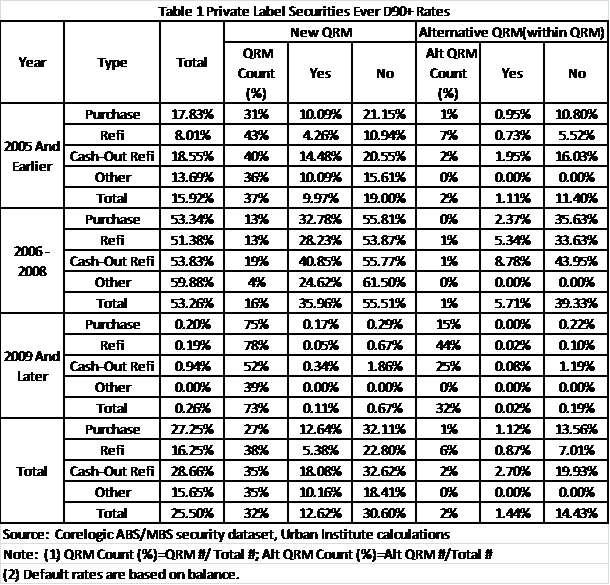
Corroborating the results reported by the agencies in the proposal, the default rates for loans that met the QM requirements are substantially lower than for those that did not. Table 1 shows that the 90+ day delinquent rate for the 2005 and earlier QM eligible loans is 9.95 percent; it is 19 percent for loans that are not QM eligible. It is 36.5 percent for QM eligible loans from the 2006-2008 vintages, but an even-higher 55.5 percent for loans from those years that are not QM eligible. The default rate of 2009 and later vintages is 0.11 percent for QM eligible loans and 0.67 percent for those that are not QM.
The results also highlight the differences in the environment over three time periods. For 2005 and earlier, the default rate on the QM loans was 9.95 percent; it was 35.6 percent for QM loans of the 2006-2008 vintages. The FICO[5] /Loan-to-Value (LTV) composition of the loans was not all that different. The big difference was the very adverse home price environment the 2006-2008 vintages faced almost immediately after the loans were closed.
Table 1 also shows the default rate for loans that meet the Alternative QRM definition.[6] The 90+ day delinquency rate on Alternative QRM loans is very low in all years: 1.1 percent for 2005 and earlier (versus 11.40 percent for mortgages which are QM, but not alternative QRM); 5.71 percent for the 2006-2008 vintages (versus 39.3 percent for loans that are QM but not alternative QRM); and for recent vintages a very low 0.02 percent for Alternative QRM and 0.19 percent for loans that are QM, but not Alternative QRM.
Although these differences look substantial, it is important to recognize that while there are a reasonable number of loans, even before 2009, that qualify if QRM=QM, the number of loans that qualify for the Alternative QRM is very low. For the 2005 and earlier vintages, while 37 percent of the loans would qualify if QRM=QM, only 2 percent would qualify under the Alternative QRM definition. For the 2006-2008 vintages, 16 percent of the loans would qualify if QRM=QM, but only 1 percent meet the Alternative. And even with the pristine recent origination, while 73 percent of the loans would qualify if QRM=QM, only 32 percent of recent PLS production meets the very high Alternative standard.
It is interesting to note that while there is little difference in the default rates between purchase loans, refinance loans, and cash-out refinance loans, there is a huge difference in Alternative QRM eligibility depending on loan purpose. A much smaller percentage of purchase loans is Alternative QRM eligible. For example, for the pristine 2009 and later origination, only 15 percent of purchase PLS loans are Alternative QRM eligible (versus 32 percent of the PLS total).
The definition of delinquency that is being used so far is ever 90+ days delinquent, the standard the agencies used in the proposal. But not every loan that goes 90+ days delinquent terminates with a loss. In an attempt to measure the number of loans that terminate, we analyzed loan performance using the following definition of termination:
- Liquidation with a loss (which should capture short sales and deeds lieu as well as REO sales)
- REO
- No payment for a 24month period
If a loan has been modified and meets any of these three conditions, we consider the loan to be terminated. If a loan has been modified, but is still paying or is not delinquent enough to be considered a termination, we do not consider the loan to be terminated.
Table 2 shows the results of this analysis. If we use termination to define default, a far lower portion of the loans would be considered to have defaulted. In particular, for the 2005 and earlier period, the default rate for QM loans is a very reasonable 5.81 percent based on termination, versus 9.97 percent using a 90+ days delinquent definition for default. The 2006-2008 number falls from 36 percent to 24 percent, while the 2009 and later number falls from 0.11 percent to 0.02 percent. On average, for the 2005 and earlier and 2006-2008 vintages, the termination rate is 50-60 percent of the 90+ days delinquent rate. It is even lower for more recent vintages.

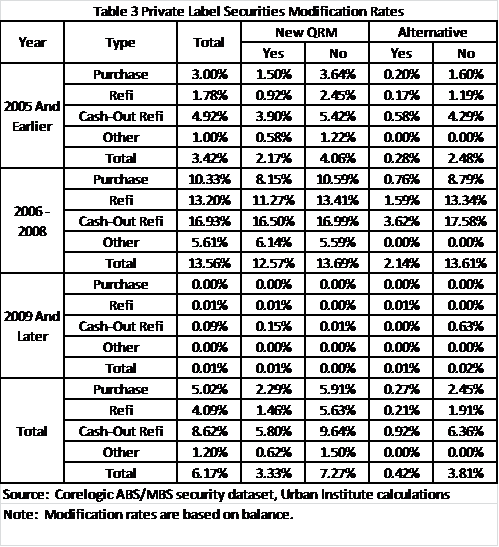
Table 3 shows the portion of loans that have been modified, but were not terminated, for each group of vintage years. For 2005 and earlier QM eligible loans, in addition to the 5.81 percent terminations, 2.2 percent of the loans have been modified. For the 2006-2008 vintage, a much larger 12.6% of the QM eligible loans have been modified. Again, these are modifications on loans that have not been terminated, and will reflect a substantial number of self-cures and successful modifications. It is not clear what the definition of default should be, but it is clear that 90+ days delinquent is a very liberal definition of default while termination is a very restrictive definition.
Default rates on GSE loans
GSE-eligible loans are automatically QM for seven years, or until the end of conservatorship. The GSEs have voluntarily decided to incorporate most of the QM standards, except the 43 percent hard cut-off on the DTI. In this analysis, we look at the default rate on GSE loans that meet all the QM standards.[7]
For this part of the analysis, we use the CoreLogic Prime Servicing Database. This database includes only about 60 percent of the universe of GSE loans, but is the best source of default information on GSE loans.[8] Table 4 shows the 90+ day delinquency rates. The conclusions are still intact: QM mortgages default less frequently than their non-QM counterparts. The total delinquency rate on the 2005 and earlier GSE mortgages using QRM=QM is 3.54 percent; it is 6.07 percent on the non-QM mortgages. The corresponding delinquency rates for 2006-2008 vintage mortgages is 12.51 percent for QRM=QM and 25.04 percent for loans that do not meet the QM eligibility criteria.

Using the Alternative QRM criteria, the delinquency rates are really low—1.07 percent of 2005 and earlier GSE loans, 3.98 percent for 2006-2008 vintages, and 0.13 percent on the 2009 and later vintages. However, very few of these loans meet the Alternative QRM criteria. As we showed in our earlier study, only 17 percent of GSE loans in the 2005 and earlier period would have qualified under the Alternative QRM treatment, 14 percent in the 2006-2008 period and 29 percent in 2009 and later.
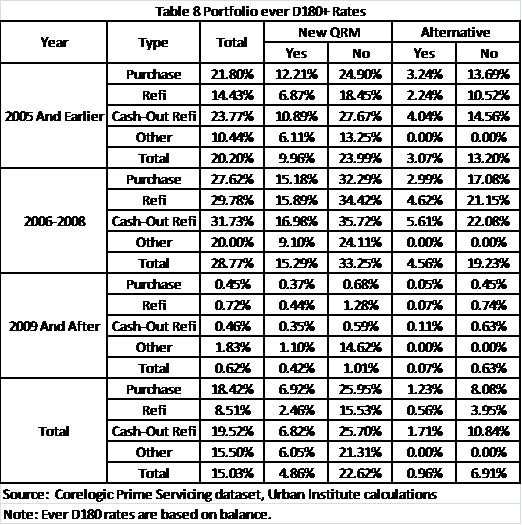
Note that thus far we have quoted only the 90+ day delinquency rates. Table 5 shows the impact of using 180+ day delinquent as the definition of default. This is the practice that was adopted in the recent GSE risk sharing deals: a credit default swap was embedded in an agency debenture, a “credit event” occurs when a loan goes 6 months delinquent; at that point the loan is removed from the pool, and the structure is written down by the amount of the loan times the preset severity.
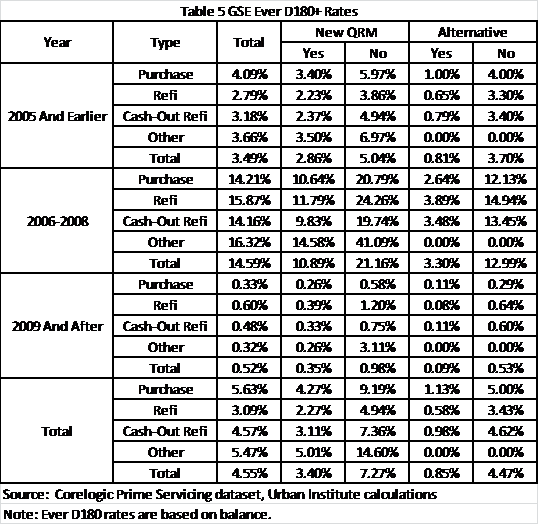
Table 6 shows the impact of using termination as the definition of default. For the prime servicing database, we do not have information on loans liquidated with a loss. When a loan is liquidated, the servicer stops reporting. Thus, our definition of termination is:
- Loan is ever 90+ days delinquent and the servicer stops reporting
- REO
- No payment in 24 months

For GSE QM loans in the 2005 and earlier period, the default rate falls to 1.13 percent using our termination definition, while it is 2.86 percent using 180+ days delinquent and 3.54 percent using 90+ days delinquent. For QM loans in the 2006-2008 period, the default rate is 4.86 percent using the termination definition, 10.89 percent using 180+ days delinquent, and 12.51 percent using 90+ days delinquent. Finally, for QM loans in the 2009 and later period, the default rate is 0.09 percent using termination, 0.39 percent using 180+ days delinquent, and 0.46 percent using 90+ days delinquent as the default definition. Obviously, the definition of default makes a huge difference in the analysis. Given the number of loans that go 90+ days delinquent and then either cure or successfully modify, a 90+ days delinquent standard overestimates the benefits of a restrictive definition of QRM.
Default rates on bank portfolio loans
In tables 7, 8, and 9 we look at default rates of bank portfolio loans in the CoreLogic Prime Servicing Database. While we tend to think of bank portfolio loans as pristine, a quick look at table 7 shows that the 90+ days delinquent numbers are overall much higher than for GSE loans, although clearly lower than for PLS loans. This reflects the fact that the bank portfolio category includes not only the very pristine loans that banks are now putting on their balance sheets, but also the less-than-pristine loans the banks acquired from failing thrifts and other entities they have taken over. It also includes the loans that have been put back by the GSEs. (We have eliminated the loans that have been put back by the FHA and VA.)

Nevertheless, the pattern we have observed in the other data holds here as well. The default rate on QM loans is much lower than on their non-QM counterparts. Thus, as shown in table 7, the default rate on QM loans (as measured by 90+ days delinquent) in the 2005 and earlier period is 11.80 percent, compared to 27.12 percent for non-QM loans. The numbers for the 2006-2008 vintages are 14.08 percent for QM loans and 29.22 percent for non-QM loans.
Defining default as termination, the default rate of QM loans for the 2005 and earlier vintage would be 4.69 percent (table 9), versus 9.96 percent at 180+ days delinquent (table 8), and 11.80 percent at 90+ days delinquent (table 7). For loans originated from 2006 through 2008, the default rate is 7.20 percent when measured by termination, 15.3 percent at 180+ days delinquent, and 17.8 percent at 90+ days delinquent.

For bank portfolio loans, we find that the default rate by all measures under the Alternative QRM is very low. For loans originated in 2005 and earlier, 3.83 percent of the Alternative QRM loans went 90+ days delinquent; the number is a still-low 5.41 percent for the 2006-2008 period and 0.12 percent for 2009 and later. The numbers are even lower using narrower definitions of default. However, only 5 percent of the 2005 and earlier loans, 3 percent of the 2006-2008 loans, and 18 percent of the 2009 and later loans would have qualified under the Alternative QRM requirements. The number of purchase loans that qualify is even smaller: 2 percent in the 2005 and earlier period, 2 percent in 2006-2008, and 6 percent in the 2009 and later period.
Conclusion
In this article, we have established the following:
- The default rates of QRM=QM loans are significantly lower than on their non-QM counterparts.
- The QRM proposal essentially defined default as 90+ days delinquent, a very tight standard. If instead, if one considers a default to be a loan that liquidates, is in REO, or has not made a payment in 2 years, the default rate is significantly lower.
- The default rates for the 2006-2008 loans are much higher than for any other period. Looking at 2005 and earlier, with its broad credit mix, default rates on QM loans are reasonable, especially using a termination standard for default.
While the default rates under the Alternative QRM are very modest, few mortgages qualify, raising a question whether the risk management benefits of the Alternative come anywhere near compensating for the very significant access restrictions that would result from the Alternative definition.
Tune in and subscribe today.
The Urban Institute podcast, Evidence in Action, inspires changemakers to lead with evidence and act with equity. Cohosted by Urban President Sarah Rosen Wartell and Executive Vice President Kimberlyn Leary, every episode features in-depth discussions with experts and leaders on topics ranging from how to advance equity, to designing innovative solutions that achieve community impact, to what it means to practice evidence-based leadership.