
It just got a little harder to buy a home. Fannie Mae recently announced that it would reduce the maximum loan-to-value (LTV) ratio for loans it purchases from 97 percent to 95 percent—meaning that borrowers now have to contribute a minimum 5 percent down payment, instead of 3 percent. This change places yet another barrier in front of low- and moderate-income families, who are already facing a tightening credit box.
Effective November 1, 2013, Fannie Mae’s new policy will apply to both standard mortgages and affordability products (such as My Community mortgages). Freddie Mac made the same move several years ago. There are three things worth noting, which we discuss below:
- Ninety-five to 97 percent LTV mortgages are a small fraction of recent mortgage originations purchased by Fannie Mae.
- Borrowers can still take out loans with LTVs above 95 percent through the FHA, VA, or USDA, so future loans will essentially shift from one set of taxpayer-backed institutions to another.
- If the intent was to reduce risk, this was a crude way to accomplish it. The default rate for 95 to 97 percent LTV mortgages is only slightly higher than for 90 to 95 LTV mortgages, and the default rate for high FICO loans with 95 to 97 LTV ratios is lower than the default rate for low FICO loans with 90 to 95 percent LTV ratios.
Only a small share of loans purchased by Fannie Mae have very high LTV ratios
Looking at Fannie Mae’s loan-level credit database, we find that between 1999 and 2012, 95 to 97 percent LTV loans comprised just under 1 percent of total originations purchased by Fannie Mae. From 1999 to 2000, these loans accounted for 3 to 3.5 percent of total originations; from 2001 to 2004, about 1 to 2 percent; and since 2005, well below 1 percent of loans purchased by Fannie Mae. These numbers understate the share of these loans, as Fannie Mae’s database excludes affordability products. It includes only 30 year, fixed rate, amortizing, full documentation loans, approximately half of Fannie’s full book of business. In addition, our data only includes originations through H1 2012, and anecdotal evidence suggests that the share of high LTV loans has risen since FHA raised its insurance premium in April 2013. Even so, the point remains: loan originations above 95 percent LTV are a tiny fraction of total originations purchased by Fannie Mae.
Very high LTV borrowers will turn to the FHA, not the private sector
If the GSEs stop purchasing above 95 percent LTV mortgages, then borrowers are likely to seek other low–down payment alternatives, such as loans made through the FHA (or, for select borrowers, the VA or USDA). Loans made through the FHA, however, come at a higher cost because of FHA’s higher mortgage insurance premiums. These mortgages will have government guarantees, so Fannie’s policy change isn’t limiting taxpayer risk—rather, it’s limiting options for borrowers.
Fannie Mae’s policy change is part of a continuing trend of tighter credit, which may make it harder for some families to buy homes. As my Urban Institute colleagues have found, homeownership is central to the ability of most Americans to build wealth.
What is Fannie Mae’s intent?
One’s first thought is that these measures were taken to reduce risk. However, the evidence does not support the point that a sharp cutoff at 95 percent LTV is the best way to accomplish this goal. Instead, the default rate of Fannie Mae loans, as on all loan products, depends on the mortgage’s complete set of risk characteristics.
The default rates for different FICO and LTV combinations of the loans originated in four select issue years—2001, 2004, 2007, and 2011—are shown in the table below. Between 1999 and 2012, the overall default rate for 90 to 95 percent LTV mortgages was 6.9 percent. It was marginally higher, at 7.1 percent, for the 95 to 97 percent LTV mortgages (see table below).
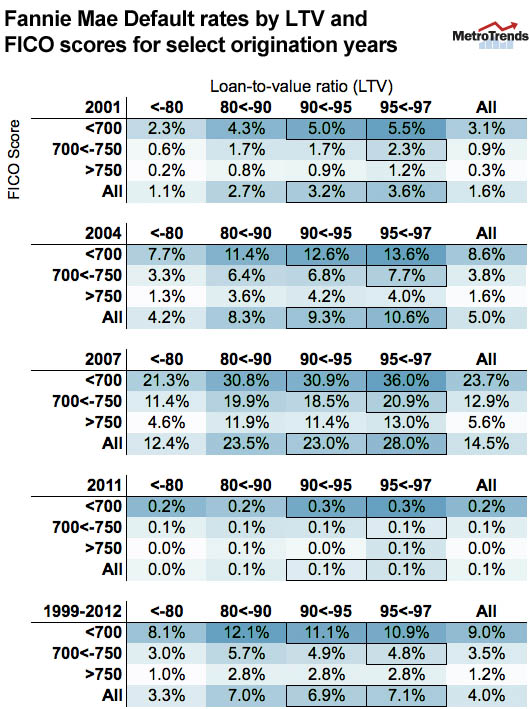
For mortgages with an LTV ratio above 80 percent, credit scores are a better predictor of default rates than LTV ratios. Looking at the rates for loans originated in 2001, the overall default rate for the 90 to 95 percent LTV bucket was 3.2 percent, which is marginally lower than the 3.6 percent rate for the 95 to 97 percent LTV loans. However, note that borrowers with FICO scores below 700 and with 90 to 95 percent LTV ratios had a default rate of 5 percent, higher than the overall default rate of 3.6 percent for the 95 to 97 percent LTV bucket, and much higher than the 2.3 percent default rate for 95 to 97 percent LTV loans in which the borrower had a FICO score between 700 and 750.
This pattern is apparent in loans originated in each and every vintage year, as shown in the table. The true default rates may be understated because the data excludes affordability products, but the relationship is clear.
If Fannie Mae had made a statement that it was cutting off credit to borrowers who had a probability of default above a certain level, then its intention would have been clearer. We would have hoped that the rich data provided by the Great Recession would give the GSEs the confidence to underwrite higher LTV loans with compensating factors, as the importance of these factors has been well tested and documented. Instead, Fannie Mae has chosen to draw sharp lines around a smaller permissible credit box without accounting for compensating factors.
Tune in and subscribe today.
The Urban Institute podcast, Evidence in Action, inspires changemakers to lead with evidence and act with equity. Cohosted by Urban President Sarah Rosen Wartell and Executive Vice President Kimberlyn Leary, every episode features in-depth discussions with experts and leaders on topics ranging from how to advance equity, to designing innovative solutions that achieve community impact, to what it means to practice evidence-based leadership.