May 27, 2016
Today’s government-centric housing finance system is an “economics free zone” indifferent to supply and demand. Composed of an alphabet soup of agencies, this system has fostered a massive liberalization of mortgage terms and provided countless trillions of dollars in lending in up and down markets. At the same time, other government polices constrain supply. As a result, housing has become less, not more affordable or accessible. Here’s why.
“[In a seller’s market] it is more likely that the liberalization of mortgage terms will increase both price and the amount of the debt, with debt service remaining approximately unchanged. … Thus, the liberalization of terms easily becomes capitalized in higher prices.” (Fisher 1951).
Because of a reliance on excessive leverage, US homeownership policy has failed to broaden homeownership access, failed to achieve wealth accumulation for low- and middle-income homeowners, and led to 11 to 12 million foreclosures since 1973.
US multifamily policy failed to promote plentiful rental housing opportunities at rents accessible to low- and moderate-income tenants (Fisher 1975; Jakabovics et al. 2014). With the supply of unsubsidized, economical, workforce housing stagnating, there are calls for large expansions in subsidies.1 Building hundreds of thousands of high-cost apartment units—with inflated costs because of federal, state, and local regulations as well as layers of subsidies to lease to extremely low and very low income households—is not viable (Fisher 1975).
The Case against Current US Homeownership Policy
For 60 years, policymakers have loosened mortgage lending standards ostensibly to promote broader homeownership and wealth accumulation, particularly for low- and moderate-income households.
-
In 1954, Federal Housing Administration (FHA) borrowers had an average loan-to-value of 79.9 percent, an average loan term of 21.4 years, and an average housing debt-to-income ratio of 15 percent.
-
By 1964, these metrics had risen to 92.8 percent, 29.9 years, and 16.5 percent, respectively.
-
Today, the average figures are 96 percent, 29.5 years, and 28 percent, respectively.
Today’s FHA borrowers spend nearly twice as much of their income—2.15 times the debt, for a home at 1.79 times the price, with 6 times the default risk under stress—compared with typical 1954 FHA borrowers with the same nominal income.
It not surprising that the FHA has experienced 3.4 million foreclosures from 1973 to 2014 (one in eight purchase borrowers) compared with a near-zero rate in its first 25 years.2 For the 25 percent of FHA borrowers living in the highest default rate zip codes, an estimated one in five lost their homes, with untold neighborhood devastation (Pinto 2012).
Fact 1: The US homeownership rate is no higher today than in the early 1960s and is only marginally higher than in 1956, before FHA loans with low down payments or 30-year terms became broadly available.3
Fact 2: Homes are less affordable today, standing at a multiple of 3.32 times median home price and median income compared with 2.95 times in 1979 or 2.86 times in 1992. A new round of increasing loan leverage began after 1992, the year Congress imposed government-sponsored enterprise (GSE) affordable housing mandates. This helped drive home prices to unsustainable levels (4.05 times in 2006). After hitting a trough of 3.03 times in 2012, the ratio now stands at 3.32 times.4
Fact 3: Low- and middle-income households have lost wealth since 1989.
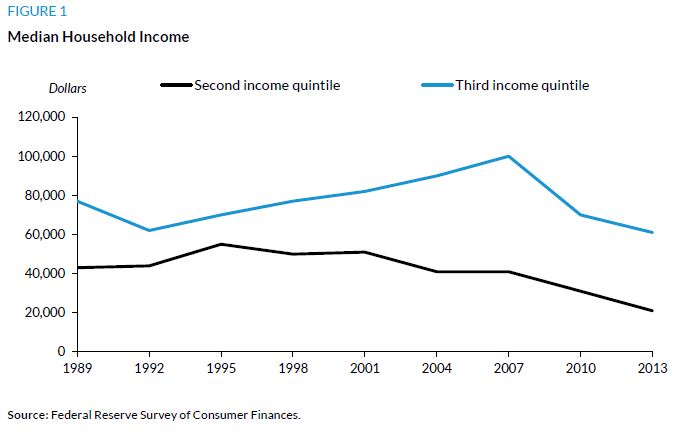
Federal Reserve Survey of Consumer Finances
Fact 4: Liberalizing credit terms during a seller’s market inflates home prices and sets up future price volatility and higher default rates under stress.5 Extended periods of increasing leverage fuel a price boom that makes homes unaffordable, promotes price volatility, and leads to unforgiving mean reversion.6
Figure 2 confirms FHA’s first chief economist Ernest M. Fisher’s 1951 prediction that in a seller’s market, liberalized credit terms easily translate into higher prices. During the current up cycle, real home prices are up 16 percent.

Up Census Bureau for new home inventories used before June 1982
In January 2015, the FHA announced a mortgage insurance premium cut during a seller’s market. It had the effect predicted by Fisher: nearly three-quarters of the additional buying power was absorbed by price (18 percent) and quality/quantity (55 percent) effects.7 Because the price effect increased the cost for all FHA buyers, the marginal cost of attracting each new first-time buyer was high ($82,000).8
Fact 5: Averages are misleading, and home prices are volatile.
National averages are misleading because they mask price volatility (figure 3) and price dispersion at the metro, zip code, and neighborhood levels (figures 4 and 5).

Zillow
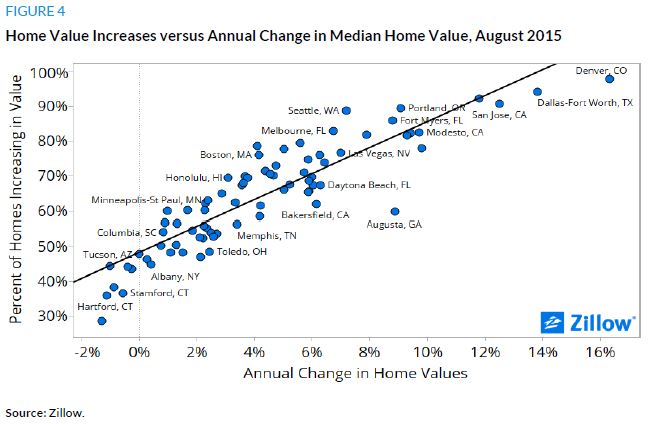
Zillow
Lower-priced homes, generally owned by low-income and minority households, experience higher price volatility and lower nominal gains. In figure 5, the bottom price tier of all 28 cities had a lower nominal price increase per year than the top tier (computed over 18 years). These borrowers also experience higher default rates because of the higher leverage.9

Zillow
Fact 6: Postcrisis credit is not tight;10 underwriting and regulatory changes promote rather than constrain a boom.11 Whether leverage is exotic is less relevant than the relative change in buying power generated by increasing leverage, which drives deviation from the price mean.
Fact 7: Federal, state, and local policies increase home-building costs (Jakabovics et al. 2014). The 10 metros with the lowest multiples of 2013 median home price and 2013 median household income had less restrictive land-use regulations. The 15 metros with the highest multiples had more restrictive land-use regulations.12 Even California has recognized that public policies are largely responsible for it being the most expensive housing market in the country (Taylor 2015). Burgeoning impact fees have a disproportionate impact by constraining the construction of entry-level homes.13
The Case against Current US Multifamily Policy
Fact 1: Rents are increasingly less affordable. In 1979 (earliest Zillow data available), median rents nationally stood at 24 percent of median incomes (Los Angeles rents stood at 30 percent of median incomes). Today, the national rate stands at 30percent with Los Angeles at 49 percent.
Fact 2: Federal, state, and local policies increase apartment construction costs. Eight of the 10 metros with the lowest multiples of 2015 median rent and median household income had less restrictive land-use regulations. Thirteen of the 15 metros with the highest multiples of 2015 median rent and median household income had more restrictive land-use regulations.14
Fact 3: Multifamily debt (in 2010 dollars) is rising much faster than the number of total units because of liberal financing from Fannie Mae, Freddie Mac, FHA, and Ginnie Mae, as well as highly accommodative monetary policy.15
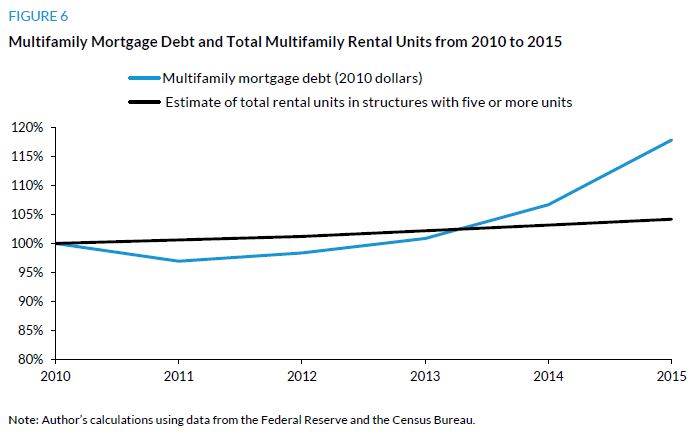
Author's calculations use data from the Federal Reserve and the Census Bureau.
Fact 4: While the Low-Income Housing Tax Credit (LIHTC) is the primary means of promoting the construction of “affordable” apartments, it’s expensive and opaque.
New LIHTC credits total $10 billion annually, funding about 100,000 LIHTC units.
-
These units have high construction costs (estimated $175,000 to $200,000 per unit).
-
These units serve few low-income tenants; 80 percent are either extremely low income (area median income less than or equal to 30 percent) or very low income (area median income from 31 to 50 percent); only 7 percent have an area median income greater than 60 percent but less than or equal to 80 percent (Furman Center 2012).
-
These units benefit from layers of subsidies, driving subsidy costs to $12,000 per unit, raising questions about unfair distribution of scarce resources. These subsidies include government-aided financing, state and local subsidies, and rental assistance (e.g., Section 8 and Housing Choice Vouchers) targeted to very low and extremely low income households.
-
This tax credit risks repeating same errors as previous housing subsidy programs.
-
Tenants are overwhelmingly minority households (61 percent), and nonelderly units are concentrated in metropolitan statistical area census tracts with high minority concentrations (Office of Policy Development and Research 2016).
-
Many developments face fiscal challenges to avoid blight that sets in after 16 to 20 years.
-
Market-Based Solutions to Bring Home Prices Back in Line with Median Incomes and Improve Accessibility
Objective: A more stable housing finance market that provides a reliable path to wealth building and broader low- and middle-income access to homeownership.
-
Repeal Title XIV (qualified mortgage) and section 941 (qualified residential mortgage) provisions of Dodd-Frank (Pinto 2016) (legislative action needed)
-
Require the FHA and GSEs to adopt sound underwriting, pricing, and capital standards (legislative and administrative action needed)
-
Repeal the GSE affordable housing goals (see replacement Low-Income First-Time Buyer tax credit below) to end destabilizing competition between the FHA and the GSEs (legislative action needed)
-
Adopt policies to support market stability by ensuring a high preponderance of good-quality mortgages (administrative action needed)
-
Help low- and middle-income families with wealth-building strategies
-
The American Enterprise Institute’s Wealth Building Home Loan offers such a path, but the 30-year mortgage does not.16(administrative action needed)
-
-
Enact the Low-income First Time Homebuyer (LIFT Home) tax credit (legislative action needed)
-
This credit would allow low-income,17 first-time buyers to forgo the interest deduction and receive a one-time refundable tax credit.
-
This credit is equal to 4 percent of the mortgage loan ($10,000 maximum) and can be used to buy down the loan’s interest rate for at least seven years on loans with terms of 20 years or less.
-
The legislation would funnel $4.5 billion per year to fund 500,000 LIFT Home buyers, 250,000 of whom would be incremental low-income, first-time buyers. This assumes that 150,000 live in apartments (freed-up units would be a bonus).
-
Funding LIFT Home would require the following:
-
Reductions in the US Department of Housing and Urban Development’s budget
-
Repurposing other budgeted amounts that support affordable housing to push tax dollars directly to homebuyers instead of having the money siphoned off by bureaucracies and advocacy groups
-
Restructuring home mortgage interest deductions to promote wealth, not debt accumulation
-
For future homebuyers, this restructuring would
-
limit interest deductions to purchase loans and exclude second mortgages and cash-out refinances (also for existing homeowners) and
-
cap mortgage interest deductions to amounts payable on a loan with a 20-year amortization term.
-
-
For existing home loan borrowers, the restructuring would
-
grandfather current interest deductions, ameliorating impact of change on current home prices; and
-
direct any interest savings (from refinancing an existing loan at a lower rate) toward shortening the loan term.
-
-
-
-
Over 10 years, these solutions would reduce capital needs by 60 percent and allow weaning off the federal government’s overwhelming loan guarantee role. Outstanding debt would be reduced by approximately 20 percent, and risk-absorbing capital per loan would be reduced by 50 percent.
-
With less interest rate risk and lower capital requirements, these loans would be safer and easier for depository institutions to hold in portfolio. Today, these institutions hold about 50 percent of total single-family mortgage debt.
Market-Based Rental Housing Solutions to Bring Rents Back in Line with Median Incomes and Improve Accessibility: the “Blight Preventer” Loan
Objectives: Shift from the current debt- and government-centric finance system to a rental housing market where supply is permitted and encouraged to meet demand; establish life cycle underwriting18 and the “Blight Preventer” Loan as best practices in financing subsidized multifamily housing.
-
Repeal GSE affordable housing policies and the Community Reinvestment Act
-
Increase supply of unsubsidized economical workforce and entry-level apartments
-
Use lifecycle underwriting and 15- and 20-year self-amortizing first mortgage—the “Blight Preventer” Loan (White and Wilkins 2016):
-
Excessively long loan terms used to finance affordable multifamily properties leave many properties unable to fulfill affordability commitments without additional public subsidies and leaves those properties poorly maintained, leading to blight and urban decay.
-
Most affordable multifamily housing is located in lower-income neighborhoods, leaving public funders to accept blight or throw good money at bad investments.
-
Bending the Cost Curve to Increase the Supply of Unsubsidized Economical Workforce and Entry-Level Houses and Apartments
-
Local and state governments should
-
authorize expedited permitting and “just-in-time” building inspections;
-
identify building code interpretations to reduce cost impact;
-
review and amend density and parking requirements, height maximums, size minimums, and other provisions that increase barriers and raise costs;
-
expand permitted uses in a zoning district that are not subject to special review and approval by local government;
-
review and amend building codes that dictate costs and amenities that put economical workforce developments at a disadvantage;
-
reduce regulatory complexity and include staff flexibility in applying and interpreting burdensome requirements (direct staff to be as flexible as possible);
-
adjust impact and permitting fees to reflect any reduced impact of such housing;
-
establish a “good enough to be economical” standard; and
-
reduce the expenses calculated as a percentage of costs.
-
-
Designers and builders should implement innovative and economical techniques for
-
design and construction,
-
sustainability,
-
utilizing existing infrastructure,
-
repurposing existing structures, and
-
management.
-
Notes
-
“Cantwell Launches National Campaign to Increase Federal Resources for Affordable Housing,” press release, March 24, 2016, https://www.cantwell.senate.gov/news/press-releases/cantwell-launches-national-campaign-to-increase-federal-resources-for-affordable-housing; Peter Dreier, “How to House the Working Poor,” How Housing Matters, last updated April 7, 2016, http://howhousingmatters.org/articles/house-working-poor/.↩
-
FHA Actuarial Studies and author. See Pinto (2012).↩
-
Edward J. Pinto, “Housing finance fact or fiction? FHA pioneered the 30-year fixed rate mortgage during the Great Depression?” AEIdeas (blog), June 24, 2015, http://www.aei.org/publication/housing-finance-fact-or-fiction-fha-pioneered-the-30-year-fixed-rate-mortgage-during-the-great-depression/.↩
-
Zillow and author. ↩
-
Liberalization of credit terms takes many forms, including smaller down payments, higher debt-to-income ratios, longer loan terms, lower interest rates, quantitative easing, and reduced mortgage insurance premium.↩
-
Mean reversion is a theory suggesting prices and returns eventually move back toward the mean.↩
-
The 0.50 percent decrease in premium increased buying power by 6 percent. This could be “spent” in three ways: price effect (seller raises price), quality/quantity effect (buyer purchases larger or better-quality home), or expanded access (attracts new buyers).↩
-
Forthcoming research to be published by Stephen Oliner, Edward Pinto, and Tobias Peter.↩
-
Default risk increased in zip codes where median family income and median home prices are low. See Pinto (2012).↩
-
First-time buyer credit metrics are follows: 69 percent of buyers have a combined loan-to-value ratio less than or equal to 95 percent, 97 percent have a 30-year loan, 29 percent have a debt-to-income ratio less than 43 percent, and 22 percent have a FICO score below 660. See “Mortgage Risk Index Release of March 2016 Data,” American Enterprise Institute’s International Center on Housing Risk, last updated April 26, 2016. As an up real estate cycle ages, credit maximums usually become minimums, thus leading to calls for even more liberal credit terms, including less traditional ones. See Fisher (1951).↩
-
For example, income leverage (measured by borrower debt-to-income ratio) is largely unconstrained by Dodd-Frank’s qualified mortgage regulation. Its 43 percent limit is swallowed by agency exemptions (Fannie, Freddie, FHA, the US Department of Veterans Affairs, and the Rural Housing Service guarantee some 85 percent of all primary home purchase loans). An effective income leverage limitation operates to “take the punch bowl away” before a leverage-fueled price boom goes too far.↩
-
Demographia.com and author; “Regulations Add a Whopping $84,671 to New Home Prices,” NAHBNow (blog), May 9, 2016, http://nahbnow.com/2016/05/regulations-add-a-whopping-84671-to-new-home-prices/.↩
-
Nick Timiraos, “How City Hall Exacerbates the Entry-Level Housing Squeeze,” The Wall Street Journal, May 5, 2016, http://blogs.wsj.com/economics/2016/05/05/how-city-hall-exacerbates-the-entry-level-housing-squeeze/.↩
-
Demographia.com and author.↩
-
Paul Bubny, “CRE Debt Increase Hits 8-Year High,” Law.com, March 15, 2016, http://www.law.com/sites/paulbubny/2016/03/15/cre-debt-increase-hits-8-year-high/?slreturn=20160419120431.↩
-
Edward Pinto and Stephen Oliner, “WBHL,” American Enterprise Institute’s International Center on Housing Risk, accessed May 19, 2016, http://www.housingrisk.org/category/wealth-building-home-loan/.↩
-
Incomes below 80 percent of the area median income.↩
-
Lifecycle underwriting considers a property’s ability to cover its long-term capital needs (e.g., replacing worn-out roofs, air conditioners, and appliances) over the property’s life cycle. See Brennan and colleagues (2013).↩
References
Brennan, Maya, Amy Deora, Ethan Handelman, Anker Heegaard, Albert Lee, Jeffrey Lubell, and Charlie Wilkins. 2013. “Lifecycle Underwriting: Potential Policy and Practical Implications." Working paper. Washington, DC: Center for Housing Policy.
Fisher, Ernest M. 1951. “Financing Home Ownership.” In Urban Real Estate Markets: Characteristics and Financing, edited by Ernest M. Fisher, 61–90. Cambridge, MA: National Bureau of Economic Research.
———. 1975. Housing Markets and Congressional Goals. Westport, CT: Praeger Publishers Inc.
Furman Center for Real Estate and Urban Policy. 2012. “What Can We Learn about the Low-Income Housing Tax Credit Program by Looking at the Tenants?” New York: New York University.
Jakabovics, Andrew, Lynn M. Ross, Molly Simpson, and Michael Spotts. 2014. Bending the Cost Curve: Solutions to Expand the Supply of Affordable Rentals. Washington, DC: Urban Land Institute.
Office of Policy Development and Research. 2016. Data on Tenants in LIHTC Units as of December 31, 2013. Washington, DC: US Department of Housing and Urban Development.
Pinto, Edward J. 2012. How the FHA Hurts Working-Class Families and Communities. Washington, DC: American Enterprise Institute.
———. 2016. “Repealing Dodd-Frank’s Qualified Mortgage and Qualified Residential Mortgage.” In The Case Against Dodd-Frank: How the “Consumer Protection” Law Endangers Americans, edited by Norbert J. Michel, 31–38. Washington, DC: The Heritage Foundation.
Taylor, Mac. 2015. California’s High Housing Costs: Causes and Consequences. Sacramento, CA: Legislative Analyst’s Office.
White, Tom, and Charlie Wilkins. 2016. “‘Blight Preventer’ Loan: Property Lifecycle Underwriting and 15–20 Year Self-Amortizing First Mortgage Debt as a Best Practice for Financing Subsidized Multifamily Housing.” Washington, DC: American Enterprise Institute.
Edward J. Pinto is an American Enterprise Institute (AEI) resident fellow and codirector of AEI’s International Center on Housing Risk. Pinto is cocreator and developer of the AEI Pinto-Oliner Mortgage Risk and Collateral Risk Indexes. He is also the cocreator of the Wealth Building Home Mortgage, a new approach to home finance designed to serve the twin goals of providing a broad range of homebuyers—including low-income, minority, and first-time buyers—a more reliable and effective means of building wealth than currently available under existing policies, while maintaining buying power similar to a 30-year loan. Active in single- and multifamily housing finance for 42 years, he was an executive vice president and chief credit officer for Fannie Mae until the late 1980s. Pinto has done groundbreaking research on the role of federal housing policy in the 2008 mortgage and financial crisis. He has no financial interest in Fannie Mae, Freddie Mac, or the Federal Home Loan Banks. As a taxpayer, he has a strong financial interest in the risks undertaken by the US Treasury and the Federal Reserve.